Fund Rankings Update, 9/16/2016

Weekly Average Momentum Index (AMI) rankings of HSA, SSPP, RSP, SELECT, ETF, iETF, sETF have been posted in "Rankings", "Trading Logs" pages, and  http://ycprankings.awardspace.us/RankingTables.htm.

Weaker retail sale and industrial production coupled with higher consumer price index eased investor's nervousness about interest rate hike in September and pushed stocks modestly higher.  For the week S&P 500 index closed at 2139, up 053%, Dow Jones Industrial Average gain 0.21% while technology laden NASDAQ composite index increased 2.31%.

Weekly chart of S&P 500 index

S&P 500 index rebounded a bit from its 28 week moving average support level as seen the weekly chart. Its STO momentum indicator has fallen out of over bought area and heading lower. The consolidating around its 28 week moving average may continue for another couple of weeks.

We have observed sector rotation in the past few weeks in the sETF and SELECT ranking tables. The energy related sectors have fallen out of favor while technology sectors have moved up the ranks. If the rotation continues, it will be reflected in our sETF and SELECT model portfolio tradings. 


Fund Rankings Update, 9/9/2016

Weekly Average Momentum Index (AMI) rankings of HSA, SSPP, RSP, SELECT, ETF, iETF, sETF have been posted in "Rankings", "Trading Logs" pages, and  http://ycprankings.awardspace.us/RankingTables.htm.

Dow Jones Industrial Average plunged more than 350 points on Friday due to jittery about interest rate hike. The one day plunge ended the flat trading for the last 7 weeks and handed stock markets the largest weekly loss since the beginning of the year. For the week S&P 500 index closed at 2127, down 2.39%, Dow Jones Industrial Average lost 2.2% and NASDAQ composite index decreased 2.36%.

Weekly chart of S&P 500 index
Instead of waiting for 28 week moving average to catch up, S&P 500 index plunged to meet the support as seen the weekly chart. Last week, we talked about S&P 500 index forming a rounded top pattern and expected consolidation phase to continue. As the index is near its support, we need to see how it reacts to the support level in the next two weeks to make judgement about its intermediate direction.

Fund Rankings Update, 9/2/2016

Weekly Average Momentum Index (AMI) rankings of HSA, SSPP, RSP, SELECT, ETF, iETF, sETF have been posted in "Rankings", "Trading Logs" pages, and  http://ycprankings.awardspace.us/RankingTables.htm.

Trading signal occurs in RSP model portfolio: Sell FNMIX, Buy 42625

In this light trading week before the labor day weekend, stocks managed to eked out a little gain with mixed economic data.  Consumer expending increased for the fourth month in July while job growth failed to meet expectation. For the week S&P 500 index closed at 2179, up 0.5%, Dow Jones Industrial Average gained 0.52% and NASDAQ composite index increased 0.59%.

Weekly chart of S&P 500 index
Although S&P 500 index closed higher this week, it is forming a rounded top pattern in the weekly chart. We expect the consolidation will continue as the index is waiting for the moving average to catch up.

A trading signal occurs this week in RSP model portfolio. The momentum ranking of Fidelity new market income fund, FNMIX, was pushed out of the holding threshold of 7th rank. The fund was replaced with the current #1 rank fund, SS emerging market index (42625).  We have held FNIMX for 137 days with a gain of 7.41%.


Fund Rankings Update, 8/27/2016

Weekly Average Momentum Index (AMI) rankings of HSA, SSPP, RSP, SELECT, ETF, iETF, sETF have been posted in "Rankings", "Trading Logs" pages, and  http://ycprankings.awardspace.us/RankingTables.htm.

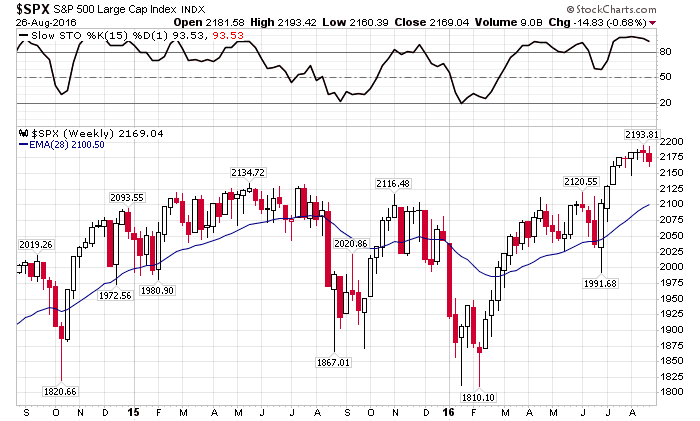
Stock markets reacted negatively to Fed Chair Janet Yellen's remark about rate hikes in the coming months. For the week S&P 500 index closed at 21693, down 0.681%, Dow Jones Industrial Average lost 0.85% and the technology laden NASDAQ composite index decreased 0.37%.

Weekly chart of S&P 500 index

Two weeks ago, we said that S&P 500 index was in an extreme overbought condition and might start seeing some consolidation, and here we are as the index has since fallen from the high of 2193 to the low of 2160 and trying to stay above the short term support of 2160. As the momentum is still in the high gear, we expected the rally will continue after this consolidate phase.


Fund Rankings Update, 8/19/2016

Weekly Average Momentum Index (AMI) rankings of HSA, SSPP, RSP, SELECT, ETF, iETF, sETF have been posted in "Rankings", "Trading Logs" pages, and  http://ycprankings.awardspace.us/RankingTables.htm.


Stocks closed almost flat for the second week looking for direction.  For the week S&P 500 index closed at 2183, down 0.01%, Dow Jones Industrial Average lost 0.13% while technology laden NASDAQ composite index increased 0.1%.


Weekly chart of S&P 500 index

Fund Rankings Update, 8/12/2016

Weekly Average Momentum Index (AMI) rankings of HSA, SSPP, RSP, SELECT, ETF, iETF, sETF have been posted in "Rankings", "Trading Logs" pages, and  http://ycprankings.awardspace.us/RankingTables.htm.

Trading signal occurs in SSPP model portfolio: Sell FIUIX, Buy FOCPX


Stocks closed flat this week as all major indices reached their all time highs mid-week.  For the week S&P 500 index closed at 2184, up 0.05%, Dow Jones Industrial Average gained 0.18% and again technology laden NASDAQ composite index increased 0.23%.

Weekly chart of S&P 500 index

After rising four weeks since end of June, S&P 500 index has slow down its advance in the past 4 weeks since mid July. During the past 4 weeks, we have seen sector rotation in the stock markets as technology and growth funds rose to the top of our momentum ranking tables, while defensive funds such as utility and income funds went down the ladders. The switching away from defensive funds indicates that this rally may have some staying power. However, as the index is at the extreme overbought condition, the rally may experience a consolidation phase before running higher.


Fund Rankings Update, 8/5/2016

Weekly Average Momentum Index (AMI) rankings of HSA, SSPP, RSP, SELECT, ETF, iETF, sETF have been posted in "Rankings", "Trading Logs" pages, and  http://ycprankings.awardspace.us/RankingTables.htm.

Trading signal occurs in SELECT model portfolio: Sell FSNGX, Buy FSMEX
Trading signal occurs in ETF model portfolio: Sell IGE, Buy ILF
Trading signal occurs in sETF model portfolio: Sell IGE, Buy IHI

Better than expected US job report push the markets higher. On Friday, Labor department reported that US economy added 255000 jobs in July, well above economists' estimation. The strong employment data in June and July gave investor confidence on the robustness of the economy growth.  Small cap and technology stocks continued to lead the way in this rally.  For the week S&P 500 index closed at 2152, up 0.43%, Dow Jones Industrial Average gained 0.6% and again technology laden NASDAQ composite index increased 1.14%.

Weekly chart of S&P 500 index
Weakness in oil prices which have fallen from $50 a barrel to $40 in the past one and half month has greatly reduced the momentum in the energy related funds. At the same time, technology sector funds and health care sector funds are gaining momenta due to better than expected company earnings. In the SELECT and sETF, our two sector fund portfolios, tradings signals were issues to due to this sector rotation. In SELECT, we will sell natural gas fund, FSNGX and buy medical system fund, FSMEX. In sETF model portfolio, we will sell natural resource index fund, IGE, and buy medical device index fund, IHI. In ETF model portfolio, we will replace IGE with Latin America index fund, ILF.  Detail trading records can be fund in the Trading log page. 

Weekly chart of light crude oil price