Fund Rankings Update, 3/17/2017

Weekly Average Momentum Index (AMI) rankings of HSA, SSPP, RSP, SELECT, ETF, iETF, sETF have been posted in "Rankings", "Trading Logs" pages, and  http://ycprankings.awardspace.us/RankingTables.htm.

Federal Reserve raised short term interest by a quarter point (0.25%) casting confidence in the economic growth.  Encouraged by Fed's stance, stocks rallied after the rate hike.  For the week, S&P 500 index closed at 2378, up 0.24%, Dow Jones Industrial Average gained 0.06% while technology laden NASDAQ composite index increased 0.67%.
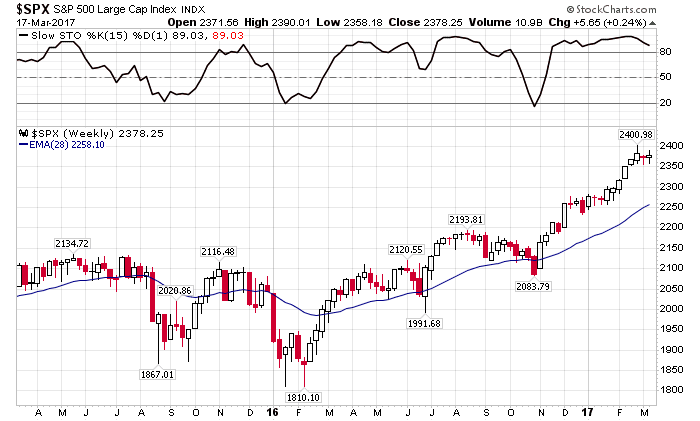
Weekly chart of S&P 500 index

In the weekly chart, S&P 500 index stalled for the second week. It is in a holding pattern waiting for the 28-week moving average to catch up. On the sectors front, we have seen surge in technology and bio-tech sectors while banking sector faded a bit. As the general market is in a holding pattern, we expect the market leadership rotation will continue for another few weeks. 


Fund Rankings Update, 3/10/2017

Weekly Average Momentum Index (AMI) rankings of HSA, SSPP, RSP, SELECT, ETF, iETF, sETF have been posted in "Rankings", "Trading Logs" pages, and  http://ycprankings.awardspace.us/RankingTables.htm.

Strong job report boosted stock prices Friday to save the otherwise down warded week.  The economy added 235,000 jobs in February and making rate hike from the FED a certainty next week.  For the week, S&P 500 index closed at 2372, down 0.44%, Dow Jones Industrial Average lost 0.498% while technology laden NASDAQ composite index decreased 0.15%.

Weekly chart of S&P 500 index

After six weeks of consecutive advanced, S&P gave out the first decline as investors digest the recent gain. The index is still way above its moving average with high momentum, and we expect a flat consolidation phase in the next few weeks.  


Fund Rankings Update, 3/3/2017

Weekly Average Momentum Index (AMI) rankings of HSA, SSPP, RSP, SELECT, ETF, iETF, sETF have been posted in "Rankings", "Trading Logs" pages, and  http://ycprankings.awardspace.us/RankingTables.htm.

Stocks rallied on Wednesday after President Trump's first speech before the congress Tuesday night. Investors like the affirmation of the lower tax, deregulation and pro-growth policies from this administration. On Friday, Fed Chair Janet Yellen indicated that a rate hike in March is almost a certainty due to positive economy outlook.  For the week, S&P 500 index closed at 2383, up 0.67%, Dow Jones Industrial Average gained 0.88% while technology laden NASDAQ composite index increased 0.44%.

Weekly chart of S&P 500 index
Technical picture of S&P 500 index remains the same. The index has gone up six weeks in a row and is more than 6% above its 28 week moving average. We think the market is due for a consolidation phase and caution is warranted.

Fund Rankings Update, 2/24/2017

Weekly Average Momentum Index (AMI) rankings of HSA, SSPP, RSP, SELECT, ETF, iETF, sETF have been posted in "Rankings", "Trading Logs" pages, and  http://ycprankings.awardspace.us/RankingTables.htm.

Trading signal occurs in HSA model portfolio:, Sell NSVAX, Buy BMCAX

Encouraged by positive earning reports from Wal-Mart and Home Depot and housing data, stocks went up at the beginning of the week but soon ran out of the steam. Released Fed meeting minutes showed the increasing likelihood of a March rate hike instead of June.  For the week, S&P 500 index closed at 2367, up 0.69%, Dow Jones Industrial Average gained 0.96% while technology laden NASDAQ composite index increased 0.12%.

Weekly chart of S&P 500 index

Without much stimulation from economic data, the advanced of S&P 500 index this week was driven mainly by the carry over momentum. It appears that the index is about to take a break after the recent run above 2300. A pause or a consolidation here will be healthy to the overall up trend.

A trading signal occurs this week in HSA model portfolio. The momentum rank of NSVAX has fallen below the trading threshold and is replaced by the number one rank fund, BMCAX.  This trading signal also reflects the under-performance of small cap stocks this year. 


Fund Rankings Update, 2/17/2017

Weekly Average Momentum Index (AMI) rankings of HSA, SSPP, RSP, SELECT, ETF, iETF, sETF have been posted in "Rankings", "Trading Logs" pages, and  http://ycprankings.awardspace.us/RankingTables.htm.

Trading signal occurs in SSPP model portfolio:, Sell FGRIX, Buy FDGRX

Encouraged by strong economic data, all major indices went up and reached record high during the week. Retail sales went up 0.6% and consumer price went up 0.3% in January. Banking and financial sectors were pushed higher as investors expect Fed to raise short term interest rate earlier than expected.  For the week, S&P 500 index closed at 2351, up 1.51%, Dow Jones Industrial Average gained 1.75% while technology laden NASDAQ composite index increased 1.82%.

Weekly chart of S&P 500 index

After breaking above short term resistance of 2300, S&P 500 keep marching higher with extreme high momentum. We expect the up-trend to continue before any correction happens.

Strong up trend has caused investors to move toward growth oriented sectors. A trading signal was issued in SSPP model portfolio to sell FGRIX and buy into FDGRX, which weighed more in growth companies. We have held FGRIX for 3 moths with a gain of 6.41%. 


Fund Rankings Update, 2/10/2017

Weekly Average Momentum Index (AMI) rankings of HSA, SSPP, RSP, SELECT, ETF, iETF, sETF have been posted in "Rankings", "Trading Logs" pages, and  http://ycprankings.awardspace.us/RankingTables.htm.

Markets were boosted by President Trump's statement again after moving side way for the first three days of the week. This time, he promised on Thursday for "something phenomenal in terms of tax" and Dow Jones Industrial Average went up more than 100 points.  Stocks rallied again on Friday and push all the major indices to new highs.  For the week, S&P 500 index closed at 2316, up 0.81%, Dow Jones Industrial Average gained 0.99% while technology laden NADASQ composite index increased 1.19%.

Weekly chart of S&P 500 index
S&P 500 index broke above the short term resistance of 2300 and heading higher. The index is way above its trend line with high momentum. We remain cautiously optimistic that the up trend will continue for a while. 

Fund Rankings Update, 2/3/3017

Weekly Average Momentum Index (AMI) rankings of HSA, SSPP, RSP, SELECT, ETF, iETF, sETF have been posted in "Rankings", "Trading Logs" pages, and  http://ycprankings.awardspace.us/RankingTables.htm.

Executive order from Trump administration to ban immigrants from seven Muslim countries spooked investors, and the markets started the weeks with a sell-off. Markets focusing on political uncertainty lingered the whole week before Friday's strong job report from Labor Department. Stocks rallied on Friday to make up the lost from the previous days.  For the week, S&P 500 index closed at 2297, up 0.12%, Dow Jones Industrial Average lost 0.11% while technology laden NADASQ composite index increased 0.11%.


Weekly chart of S&P 500 index

Buoyed by the high momentum, S&P 500 index keeps marching higher. The up trend appears to be intact and continues to trend higher before any meaningful correction occurs. 2300 looks to be a short term resistance for S&P 500 index and we will find out the strength of this resistance in the next couple weeks.