 |
| weekly chart of S&P 500 index |
Fund Rankings Update, 6/16/2017
Weekly Average Momentum Index (AMI) rankings of HSA, SSPP, RSP, SELECT, ETF, iETF, sETF have been posted in "Rankings", "Trading Logs" pages, and http://ycprankings.awardspace.us/RankingTables.htm.
It was a typical summer trading week. Federal Reserve raised interest rate as expected while US retail sales came in weaker than expected. As sell-off in technology sector continued, NASDAQ composite index lagged the other major indices. For the week, S&P 500 index closed at 2433, up 0.06%, Dow Jones Industrial Average gained 0.53% and NASDAQ composite index decreased 0.9%.
S&P 500 index eked out a small gain in the face of sell-off in technology sector. In the sETF and SELECT ranking tables, we can see the short term momentum indicator (SMI) of the software and computer related sectors has decreased in the last two weeks. Money rotated out of the technology sectors went into defensive sectors like health care , medical device and utility. With major indices, especially NASDAQ, over-extended themselves in May, we may see consolidation similar to the one in March and April continues.
Fund Rankings Update, 6/9/2017
Weekly Average Momentum Index (AMI) rankings of HSA, SSPP, RSP, SELECT, ETF, iETF, sETF have been posted in "Rankings", "Trading Logs" pages, and http://ycprankings.awardspace.us/RankingTables.htm.
Trading signal occurs in SELECT model portfolio: Sell FDCPX, Buy FSPTX
Without major economic news, it was a typical quiet summer trading week till Friday. Sell off in leading technology companies pulled NASDAQ composite index more than 100 points in a day, while S&P 500 index and Dow Jones Industrial Average closed the day flat. For the week, S&P 500 index closed at 2431, down 0.3%, Dow Jones Industrial Average gained 0.31% and NASDAQ composite index decreased 1.55%.
Without major economic news, it was a typical quiet summer trading week till Friday. Sell off in leading technology companies pulled NASDAQ composite index more than 100 points in a day, while S&P 500 index and Dow Jones Industrial Average closed the day flat. For the week, S&P 500 index closed at 2431, down 0.3%, Dow Jones Industrial Average gained 0.31% and NASDAQ composite index decreased 1.55%.
 |
| Weekly chart of S&P 500 index |
Even with sharp drop in prices of leading technology companies due to profit taking on Friday, S&P 500 still stays the course marching higher with high momentum. Outlook for S&P 500 index remains positive, as there is no deterioration in its technical picture.
Fund Rankings Update, 6/3/2017
Weekly Average Momentum Index (AMI) rankings of HSA, SSPP, RSP, SELECT, ETF, iETF, sETF have been posted in "Rankings", "Trading Logs" pages, and http://ycprankings.awardspace.us/RankingTables.htm.
US job report showed increase of only 138,000 jobs in May, lower than expectation but major stock indices still trending higher. For the week, S&P 500 index closed at 2439, up 0.96%, Dow Jones Industrial Average gained 0.6% and NASDAQ composite index increased 1.54%.
 |
| Weekly chart of S&P 500 index |
S&P 500 index first reached the intra-week high of 2400 in February. After struggling for 11 weeks and several attempts, it finally closed above the 2400 resistance last week and advanced even higher this week. With the resistance behind its back, we expect the index to continue the uptrend and climb higher.
Fund Rankings Update, 5/26/2017
Weekly Average Momentum Index (AMI) rankings of HSA, SSPP, RSP, SELECT, ETF, iETF, sETF have been posted in "Rankings", "Trading Logs" pages, and http://ycprankings.awardspace.us/RankingTables.htm.
With no political news dragging behind, stocks powered ahead. S&P 500 index and Nasdaq composite index all reached record high. For the week, S&P 500 index closed at 2415, up 1.43%, Dow Jones Industrial Average lost 1.32% and NASDAQ composite index increased 2.08%.
 |
| Weekly chart of S&P 500 index |
Fund Rankings Update, 5/19/2017
Weekly Average Momentum Index (AMI) rankings of HSA, SSPP, RSP, SELECT, ETF, iETF, sETF have been posted in "Rankings", "Trading Logs" pages, and http://ycprankings.awardspace.us/RankingTables.htm.
Trading signal occurs in iETF model portfolio: Sell INP, Buy EWP
Political turmoil shook Wall Street's confidence about economy policy reform from Trump administration mid-week. Major indices fell sharply on Wednesday with Dow Jones Industrial Average dropped more than 300 points in one day. However, markets recovered quickly Thursday and Friday and DJIA gained back two third of its loss. For the week, S&P 500 index closed at 2381, down 0.38%, Dow Jones Industrial Average lost 0.44% and NASDAQ composite index decreased 0.61%.
Again, S&P 500 index failed to closed above 2400 resistance in the weekly chart. The index broke above 2400 on Tuesday but fell off sharply right away Wednesday and closed below 2400 for the week. Even though the index still managed to stay above 28 week moving average, the failure to break the resistance and the increase in volatility do not bode well for the up-trend. A correction phase may be upon us, if the large intra-week swing continues.
Political turmoil shook Wall Street's confidence about economy policy reform from Trump administration mid-week. Major indices fell sharply on Wednesday with Dow Jones Industrial Average dropped more than 300 points in one day. However, markets recovered quickly Thursday and Friday and DJIA gained back two third of its loss. For the week, S&P 500 index closed at 2381, down 0.38%, Dow Jones Industrial Average lost 0.44% and NASDAQ composite index decreased 0.61%.
 |
| Weekly chart of S&P 500 index |
Again, S&P 500 index failed to closed above 2400 resistance in the weekly chart. The index broke above 2400 on Tuesday but fell off sharply right away Wednesday and closed below 2400 for the week. Even though the index still managed to stay above 28 week moving average, the failure to break the resistance and the increase in volatility do not bode well for the up-trend. A correction phase may be upon us, if the large intra-week swing continues.
Fund Rankings Update, 5/12/2017
Weekly Average Momentum Index (AMI) rankings of HSA, SSPP, RSP, SELECT, ETF, iETF, sETF have been posted in "Rankings", "Trading Logs" pages, and http://ycprankings.awardspace.us/RankingTables.htm.
Trading signal occurs in HSA model portfolio: Sell BMCAX, Buy TGVAX
Boosted by Apple Computer, technology laden NASDAQ composite index outperformed other major indices for the fourth week. For the week, S&P 500 index closed at 2390, down 0.35%, Dow Jones Industrial Average lost 0.53% while NASDAQ composite index increased 0.34%.
Boosted by Apple Computer, technology laden NASDAQ composite index outperformed other major indices for the fourth week. For the week, S&P 500 index closed at 2390, down 0.35%, Dow Jones Industrial Average lost 0.53% while NASDAQ composite index increased 0.34%.
 |
| Weekly chart of S&P 500 index |
2400 appears to be a very strong resistance level for S&P 500 index. For the third week, the index has failed to close above 2400. As the momentum indicator is still heading upward, we will give it another week to see if the index can continue the run.
Fund Rankings Update, 5/5/2017
Weekly Average Momentum Index (AMI) rankings of HSA, SSPP, RSP, SELECT, ETF, iETF, sETF have been posted in "Rankings", "Trading Logs" pages, and http://ycprankings.awardspace.us/RankingTables.htm.
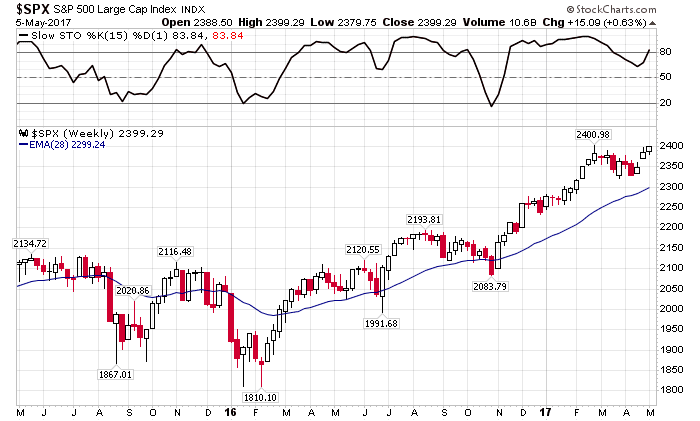
Federal Reserve's decision to keep interest unchanged on Wednesday and better than expected job report kept stocks on the positive note. Technology laden NASDAQ composite index continued to outperform other major indices for the third week. For the week, S&P 500 index closed at 23994, up 0.63%, Dow Jones Industrial Average gained 0.32% and NASDAQ composite index increased 0.88%.
S&P 500 tried and failed to break the 2400 resistance for the second week, but its momentum indicator has turned around and heading upwards again. Daily chart of S&P 500 index also showed that the index has been trading between 2380 and 2400 for two weeks. It is likely that we will see a break out next week.
 |
| Weekly chart of S&P 500 index |
S&P 500 tried and failed to break the 2400 resistance for the second week, but its momentum indicator has turned around and heading upwards again. Daily chart of S&P 500 index also showed that the index has been trading between 2380 and 2400 for two weeks. It is likely that we will see a break out next week.
From SELECT and sETF ranking tables, we also observed strong momentum in technology sector and healthcare sector. The related sector funds have moved up in the rankings tables for the past six weeks, and have pushed NASDAQ composite index to all time high. With technology sector leading the way, it is likely the major indices will follow suit, and that is consistent with our outlook earlier.
Subscribe to:
Posts (Atom)