Weekly Average Momentum Index (AMI) rankings of HSA, SSPP, RSP, SELECT, ETF, iETF, sETF have been posted at https://sites.google.com/site/ycprankings/ and AMI Tables and Logs
As concern about US military strike in Syria subsided and more and more investors are used to the idea of Fed's tapering of QE starting in September, all major indexes rallied right from the beginning of the week and maintain the momentum though out the week. Stocks ended up strong for the second week with S&P 500 index closed at 1687, up 1.98%, Dow Jones Industrial Average gained 3.04%, and Nasdaq composite increased 1.7% for the week.
In the daily chart, S&P 500 index has decisively broken above its 50 day moving average. Coupled with rising STO momentum indicator and positive MACD, we have to say that the consolidation/correction has ended and the intermediate term rally has resumed.
Daily chart of S&P 500 index
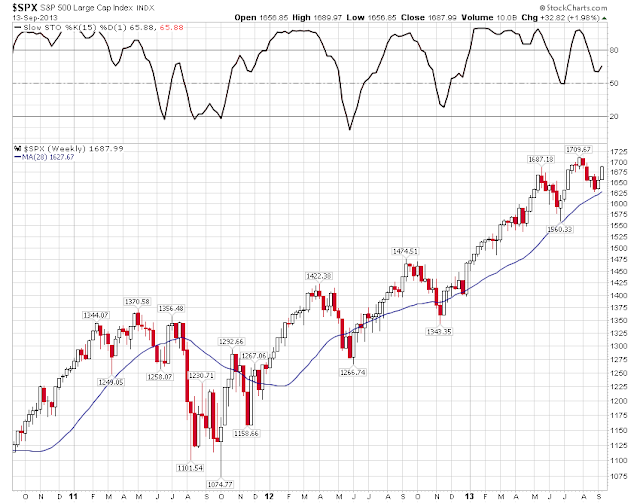
Weekly chart of S&P 500 index
Apple announced new i-phone 5S and i-phone 5C on Tuesday. The fact that it is an incremental product improvement and no announcement on China Mobil deal caused the stock to plunge from $507 to $465 in three days. Let's look at the daily chart and see if we could have traded the stock for profit and avoided this sudden loss. Apple stock started the rally in July when its STO indicator climbed up from over-sold area (20), traders could buy into the stock when its MACD turned positive around July 2 or July 3 at $420. Apple then rallied for the whole July and made a big jump after breaking 450-460 level to 500 level in August as the new i-phone 5 product release approached. However, as the release date got closer, investors became more nervous about the lack of innovation in the new products. The rally started to weakened after the stock made the short term high of $513 on 8/19 as traders began to take profit. Technically, Apple stock's daily STO momentum indicator lost steam and MACD headed lower and lower as observed in the daily chart. On August 27, Apple's MACD turned negative with its STO already fell below 80 triggering a sell signal. Traders could have sold its Apple holdings at $490 with a holding period of 56 days (~2 months) and a gain of about 16%. As you can see in this example trade, we have not timed the stock to catch the exact bottom of $386 or the exact peak of $513, rather we bought in to the stock when the rally was established and sold the stock when its weakness was confirmed. By paying attention to the stock price trend and its technical indicators which reflect investors' collective sentiment, we have kept the profit we made and avoided the big plunge after the new i-phone 5S announcement.
Daily chart of AAPL


