Fund Rankings Update, 4/25/2014

Weekly Average Momentum Index (AMI) rankings of HSA, SSPP, RSP, SELECT, ETF, iETF, sETF have been posted at "Rankings", "Trading Logs" pages, and  http://ycprankings.awardspace.us/RankingTables.htm.


US stocks went up early in the week due to strong company earnings but escalating tension in Ukraine pulled the stocks down late in the week. S&P 500 index closed at 1863, down 0.03%, Dow Jones Industrial Average lost 0.29%, and Nasdaq composite decreased 0.49% for the week.   

All three major indices closed the week above their 28 moving averages. S&P 500 index is still consolidating around 1850 level while Nasdaq composite is consolidating around its support at 4100. We are approaching the month of May which is seasonally weak month for stocks, so another few weeks of consolidation with downside bias is expected.   


Weekly Chart of S&P 500 Index

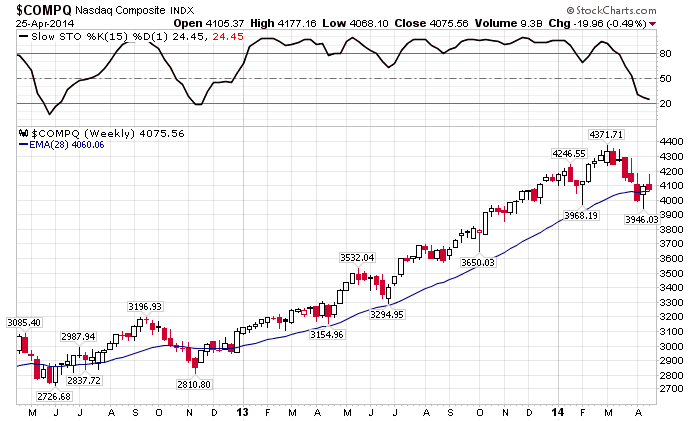
Weekly Chart of NASDAQ Composite Index

Fund Rankings Update, 4/18/2014

Weekly Average Momentum Index (AMI) rankings of HSA, SSPP, RSP, SELECT, ETF, iETF, sETF have been posted at "Rankings", "Trading Logs" pages, and  http://ycprankings.awardspace.us/RankingTables.htm.


It is still a tug of war between bulls and bears around S&P 500 index around 1850 level, and bulls won this week.  S&P 500 index closed at 1864, up 2.71%, Dow Jones Industrial Average gained 2.38%, and Nasdaq composite increased 2.39% for the week.   

It is encouraging to see that both S&P 500 and Nasdaq composite indices all rebounded nicely from their 28 week moving averages as shown in the weekly charts below. For Nasdaq composite index, we need another couple of weeks to see if the support really holds.  If the support holds, the uptrend appears to continue at a slower growth rate for both indices.


Fund Rankings Update, 4/11/2014

Weekly Average Momentum Index (AMI) rankings of HSA, SSPP, RSP, SELECT, ETF, iETF, sETF have been posted at http://ycprankings.awardspace.us/RankingTables.htm  and AMI Tables and Logs


After flirting around 1850 support/resistance level for 6 weeks, S&P 500 index finally given up and dragged down by sell-off in momentum stocks. S&P 500 index closed at 1815, down 2.65%, Dow Jones Industrial Average lost 2.35%, while Nasdaq composite decreased 3.1% for the week.   

Weekly chart shows that S&P 500 index is right above its 28 moving average trend line after giving up 1850 level. In the past year, the index has bounced right off the support 4 times to maintain the up tend, and we will see how it reacts this time in the next couple of weeks. However, following the discussion last week, the technology laden Nasdaq composite has not fared well with the support level this time. The index broke and closed below the support for the first time since beginning of 2013. This signals a trend change for Nasdaq composite index, and I am afraid that it will propagate to broader market and affect the S&P 500 index. The next support levels for Nasdaq composite index are 3900 and 3600 and 1715 and 1610 for S&P 500 index.


Weekly chart of S&P 500 index

Weekly chart of Nasdaq composite Index

Fund Rankings Update, 4/4/2014

Weekly Average Momentum Index (AMI) rankings of HSA, SSPP, RSP, SELECT, ETF, iETF, sETF have been posted at http://ycprankings.awardspace.us/RankingTables.htm  and AMI Tables and Logs

Trading signal occurs in RSP model portfolio: Sell FDGRX, Buy 05087.
Trading signal occurs in SSPP model portfolio: Sell FOCPX, Buy FRESX.
Trading signal occurs in SELECT model portfolio: Sell FBIOX, Buy FSELX.
Trading signal occurs in ETF model portfolio: Sell IBB, Buy IGN.


Stocks continued to consolidate around S&P 1850 area with momentum stocks lost their shine. S&P 500 index closed at 1865, up 0.4%, Dow Jones Industrial Average gained 0.55%, while Nasdaq composite decreased 0.67% for the week. Technology laden Nasdaq composite has experienced pulled back from its recent peak of 4370. The index is right above its 28 week moving average and we will see how it reacts to the support line.  

Severe sector rotation mentioned last week has caused quite a few position changes in our model portfolios. Investors are dumping momentum stocks in favor of risk averse sectors. Four trading signals were issued this week with various profit and loss. Plus the trading signal last week, we have five of out eight position changes in our model portfolios. Amazingly, the international funds hold up pretty well in this round of volatility and outperform the domestic funds.


Weekly Chart of Nasdaq Composite Index