First quarter US GDP was revised down from positive 0.1% to negative 1% but economists and investors expect economy to pick up steam in the second quarter. Riding the expectation, major indices advanced for the second week. S&P 500 index closed at 1923, up 1.21%, Dow Jones Industrial Average gained 0.67%, while Nasdaq composite increased 1.36% for the week.
S&P 500 index broke above the psychological barrier of 1900, and Nasdaq composite has rebounded nicely from its 28 week moving average. Momentum of both indices have picked up and we expect the rally to continue for at least another few weeks.
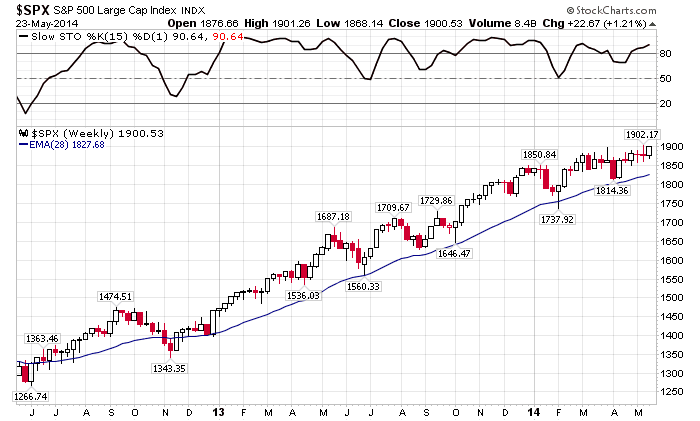
 |
| Weekly Chart of S&P 500 Index |
 |
| Weekly Chart of NASDAQ Composite Index |