Fund Rankings Update, 5/29/2015

Weekly Average Momentum Index (AMI) rankings of HSA, SSPP, RSP, SELECT, ETF, iETF, sETF have been posted in "Rankings", "Trading Logs" pages, and  http://ycprankings.awardspace.us/RankingTables.htm.


Trading signal occurs in SSPP model portfolio: Sell FOCPX, Buy FIEUX.

Wall street is still seeking direction with the backdrop of mixed economy data. Expansion in new home sales and increased manufacturing activities mingled with GDP contracted 0.7%, much lower than the expected 0.2%,in the first quarter.  For the week S&P 500 index went down 0.88% and closed at 2107, Dow Jones Industrial Average lost 1.21% and the NASDAQ composite index decreased 0.38%.

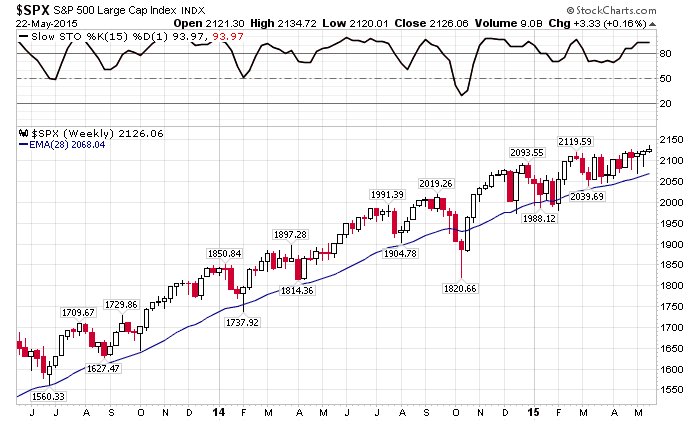
Weekly chart of S&P index
ECB's "QE" police has propped up economic activities in Europe. A trading signal occurs this week in SSPP model portfolio to replace Fidelity OTC portfolio fund, FOCPX, with the Europe Fund, FIEUX. We have held FOCPX for 249 days with a gain of 13.4%.

Fund Rankings Update, 5/22/2015

Weekly Average Momentum Index (AMI) rankings of HSA, SSPP, RSP, SELECT, ETF, iETF, sETF have been posted in "Rankings", "Trading Logs" pages, and  http://ycprankings.awardspace.us/RankingTables.htm.


Without major economic data, stocks traded at the high end of their trading channels but failed to decisively break the resistance in this pre-holiday trading week.  For the week S&P 500 index went up 0.16% and closed at 2126, Dow Jones Industrial Average lost 0.22%, and Nasdaq composite index increased 0.81%.    


Weekly chart of S&P 500 index

Fund Rankings Update, 5/15/2015

Weekly Average Momentum Index (AMI) rankings of HSA, SSPP, RSP, SELECT, ETF, iETF, sETF have been posted in "Rankings", "Trading Logs" pages, and  http://ycprankings.awardspace.us/RankingTables.htm.


Same trading pattern repeated again: Stocks traded lower early in the week but ended up higher. For the week S&P 500 index went up 0.31% and closed at 2122, Dow Jones Industrial Average gained 0.46%, and Nasdaq composite index increased 0.89%.    


Technical trading pattern or S&P 500 index stays the same as last week.  In the seasonally weak trading period, we just have to patiently wait for the market to unfold itself.  

Weekly chart of S&P 500 index

Fund Rankings Update, 5/8/2015

Weekly Average Momentum Index (AMI) rankings of HSA, SSPP, RSP, SELECT, ETF, iETF, sETF have been posted in "Rankings", "Trading Logs" pages, and  http://ycprankings.awardspace.us/RankingTables.htm.


Stocks traded at the similar pattern as last week: Rally on Friday saved the sell-off in the mid-week. US payroll data showed economy created 230k jobs and the unemployment rate ticked down to 5.4%. Despite strong dollars and week oil prices, company earning has been stronger than expected.  For the week S&P 500 index went up 0.37% and closed at 2116, Dow Jones Industrial Average gained 0.93%, and Nasdaq composite index decreased 0.04%.    

S&P 500 index is still trading within the 2040 and 2120 channel. The index has rebounded several times from its 28 week moving average and the momentum indicator has turned upwards. Most likely the index will break though the resistance on the upside.

Weekly chart of S&P 500 index

Fund Rankings Update, 5/1/2015

Weekly Average Momentum Index (AMI) rankings of HSA, SSPP, RSP, SELECT, ETF, iETF, sETF have been posted in "Rankings", "Trading Logs" pages, and  http://ycprankings.awardspace.us/RankingTables.htm.


Some bad earning reports from tech sector and slower than expected GDP growth in the first quarter dragged down the stock stock prices for the whole week before the rebound on Friday. For the week S&P 500 index went down 0.44% and closed at 2108, Dow Jones Industrial Average lost 0.31%, and Nasdaq composite index decreased 1.7%.    

As observed in the weekly chart, S&P 500 index is still trading within the 2040 and 2120 channel. The 2120 level turns out to be a very stronresistance. The index has tried to break though the resistance since February but failed to do so. Again, the weekly trading range has been reduced in the past three weeks and the index looks to be ready for a breakout.

Weekly chart of S&P 500 index
 Biotech index (IBB) has suffered a serious pulled back as it has lost 5.4% last week due to high valuation and profit taking IBB has dropped to the low of $330 nearly touching the 28 week moving average at $324 before Friday's rebound to $344. We have discussed the over extension of biotech sector fund in our March blog and cautioned about a correction back to the 28 week moving average. In the weekly chart, every time a pullback to or near the 28 week moving average has shown to be a good opportunity to buy into the index. We will see if this is another one in the making 

Weekly chart of IBB