After failing reach the psychological resistance of DJIA 20000, stocks declined in this light trading week before the end of 2016. For the week, S&P 500 index closed at 2238, down 1.1%, Dow Jones Industrial Average lost 0.86% and technology laden NADASQ composite index decreased 1.46%.
 |
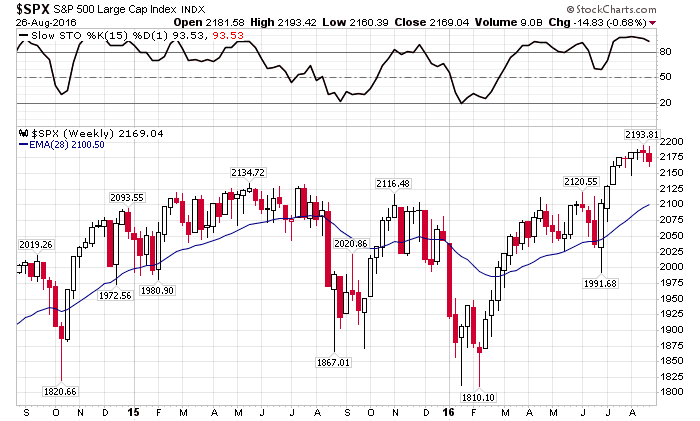
| Weekly chart of S&P 500 index |
From weekly chart, S&P 500 index is consolidating after seven weeks of advance as we have discussed in the blog last week. The index started out this year with a big plunge due to concern about global economy growth especially China. It then started to recover in February after forming a double bottom pattern. In July, the index broke above the previous high of 2130 to reach the all time high of 2193 in August. As the US presidential election getting closer, uncertainty heighten and the index pulled back and briefly dipped below the 28 week moving average in late October. After the election completed, investors looked toward a more pro-growth administration and the index resumed its rally and headed higher. For the year, S&P 500 index went up 9.5%, DJIA increased 13.4% and Nasdaq rose 7.5%. In a not so mathematical rigorous comparison, our SELECT model portfolio went up 18%, sETF increased 22%, ETF rose 9% SSPP grew 12%, RSP is up 11% and FEMKX climbed 7.7% . Happy new year and a prosperous 2017!!