Fund Rankings Update, 3/24/2017

Weekly Average Momentum Index (AMI) rankings of HSA, SSPP, RSP, SELECT, ETF, iETF, sETF have been posted in "Rankings", "Trading Logs" pages, and  http://ycprankings.awardspace.us/RankingTables.htm.

Trading signal occurs in SELECT model portfolio: Sell FSRBX, Buy FDCPX
Trading signal occurs in sETF model portfolio: Sell IAT, Buy ITB


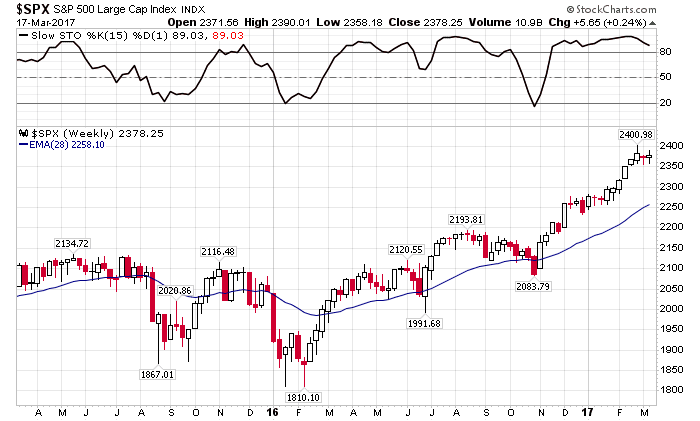
Uncertainty about the passing of a new health care law which handed the stock market a more than 1% decline since the start of the year. For the week, S&P 500 index closed at 2343, down 1.44%, Dow Jones Industrial Average lost 1.52% and the technology laden NASDAQ composite index decreased 1.22%.

Weekly chart of S&P 500 index

Fund Rankings Update, 3/17/2017

Weekly Average Momentum Index (AMI) rankings of HSA, SSPP, RSP, SELECT, ETF, iETF, sETF have been posted in "Rankings", "Trading Logs" pages, and  http://ycprankings.awardspace.us/RankingTables.htm.

Federal Reserve raised short term interest by a quarter point (0.25%) casting confidence in the economic growth.  Encouraged by Fed's stance, stocks rallied after the rate hike.  For the week, S&P 500 index closed at 2378, up 0.24%, Dow Jones Industrial Average gained 0.06% while technology laden NASDAQ composite index increased 0.67%.

Weekly chart of S&P 500 index

In the weekly chart, S&P 500 index stalled for the second week. It is in a holding pattern waiting for the 28-week moving average to catch up. On the sectors front, we have seen surge in technology and bio-tech sectors while banking sector faded a bit. As the general market is in a holding pattern, we expect the market leadership rotation will continue for another few weeks. 


Fund Rankings Update, 3/10/2017

Weekly Average Momentum Index (AMI) rankings of HSA, SSPP, RSP, SELECT, ETF, iETF, sETF have been posted in "Rankings", "Trading Logs" pages, and  http://ycprankings.awardspace.us/RankingTables.htm.

Strong job report boosted stock prices Friday to save the otherwise down warded week.  The economy added 235,000 jobs in February and making rate hike from the FED a certainty next week.  For the week, S&P 500 index closed at 2372, down 0.44%, Dow Jones Industrial Average lost 0.498% while technology laden NASDAQ composite index decreased 0.15%.

Weekly chart of S&P 500 index

After six weeks of consecutive advanced, S&P gave out the first decline as investors digest the recent gain. The index is still way above its moving average with high momentum, and we expect a flat consolidation phase in the next few weeks.  


Fund Rankings Update, 3/3/2017

Weekly Average Momentum Index (AMI) rankings of HSA, SSPP, RSP, SELECT, ETF, iETF, sETF have been posted in "Rankings", "Trading Logs" pages, and  http://ycprankings.awardspace.us/RankingTables.htm.

Stocks rallied on Wednesday after President Trump's first speech before the congress Tuesday night. Investors like the affirmation of the lower tax, deregulation and pro-growth policies from this administration. On Friday, Fed Chair Janet Yellen indicated that a rate hike in March is almost a certainty due to positive economy outlook.  For the week, S&P 500 index closed at 2383, up 0.67%, Dow Jones Industrial Average gained 0.88% while technology laden NASDAQ composite index increased 0.44%.

Weekly chart of S&P 500 index
Technical picture of S&P 500 index remains the same. The index has gone up six weeks in a row and is more than 6% above its 28 week moving average. We think the market is due for a consolidation phase and caution is warranted.