Weekly Average Momentum Index (AMI) rankings of HSA, SSPP, RSP, SELECT, ETF, iETF, sETF have been posted in "Rankings", "Trading Logs" pages, and http://ycprankings.awardspace.us/RankingTables.htm.
Trading signal occurs in ETF model portfolio: Sell IYH, Buy IDU
Trading signal occurs in sETF model: portfolio: Sell IHF, Buy IDU
Stocks struggled to rebound from the sharp plunge last week. Fear of global economy slowdown weighed in on market sentiments as weak economic data trickled in from China, Germany and France over the week. For the week, S&P 500 index closed at 2599 down 1.26%, Dow Jones Industrial Average lost 1.18% and technology laden NASDAQ composite index decreased 0.84%.
 |
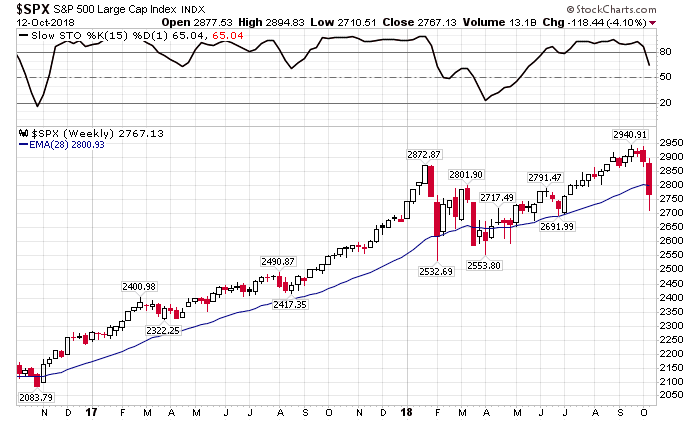
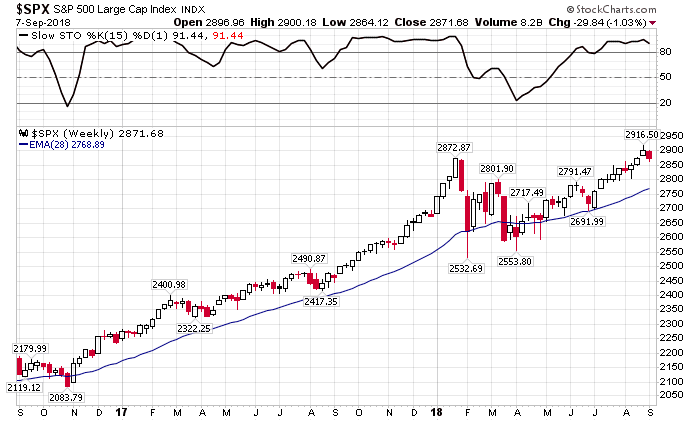
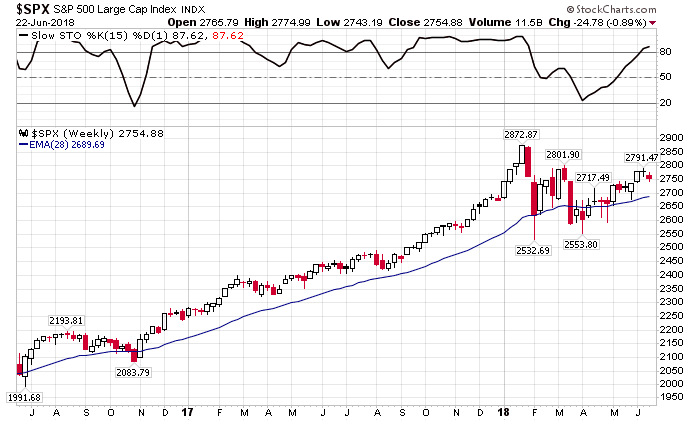
| Weekly chart of S&P 500 index |
S&P 500 turned in an impressive reversal candle stick pattern in the daily chart on Monday. The index initially went down 47 points to 2583, but miraculously reversed itself and ended up 7 points higher at 2637. However, negative sentiment prevailed and pulled the market down for another week. On the bright side, the index closed this week right at the 2600 support level. Hopefully Santa will bring some optimism to the market to reinforce this support level.
As market down trend continues, two of our model portfolios have changed their holdings to move to even more defensive positions. With negative average momentum indices (AMIs), ETF and sETF model portfolios have signaled to sell their current holdings and move to utility index fund, IDU.
This month is when fund companies distribute their year-end dividend and capital gains. These distributions greatly affect the momentum ranking calculation, and I have tried to take them into account as accurately as I can. However, these data are not publicly available and not accurate even if they are available. Please noted the rankings may have larger error margin during this time.