Fund Rankings Update, 12/24/2021

 Weekly Average Momentum Index (AMI) rankings of HSA, SSPP, RSP, SELECT, ETF, iETF, sETF have been posted in "Rankings", "Trading Logs" pages, as well as in http://ycprankings.awardspace.us/RankingTables.htm


Major indices rebounded in this holiday shorten week as concern about Covid Omicron variant abated. Positive economic data on durable good order and consumer confidence during the week also helped to push stocks higher.   For the week, S&P 500 index went up 2.28% to 4725, Dow Jones Industrial Average gained 1.65%, and the technology laden NASDAQ composite index increased 3.19%. 

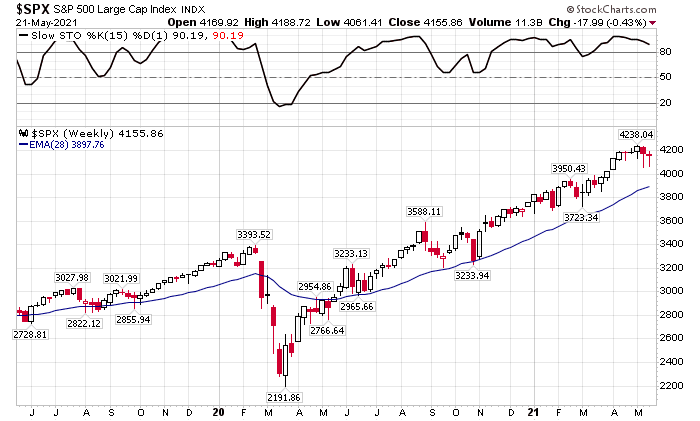
On the technical front, the S&P 500 index has been in horizontal consolidation since early November.  The index has managed to stay about its 28 week EMA and its momentum indicator has climbed back to overbought region and heading higher. Investors usually buy back stocks in January, after year-end tax selling (the so called January effect). We will see how that plays out early next year.  In the meantime, our cautiously positive outlook for the next few weeks stay the same.   


Weely chart of S&P 500 index


Fund Rankings Update, 12/17/2021

Weekly Average Momentum Index (AMI) rankings of HSA, SSPP, RSP, SELECT, ETF, iETF, sETF have been posted in "Rankings", "Trading Logs" pages, as well as in http://ycprankings.awardspace.us/RankingTables.htm


Major indices gave up some of their gains from last week as FED indicated more rate hikes in 2022 and faster tapering of asset buying program. For the week, S&P 500 index went down 1.94% to 4620, Dow Jones Industrial Average lost 1.58%, and the technology laden NASDAQ composite index decreased 2.95%. 


Weekly chart of &P 500 index


Fund Rankings Update, 12/10/2021

Weekly Average Momentum Index (AMI) rankings of HSA, SSPP, RSP, SELECT, ETF, iETF, sETF have been posted in "Rankings", "Trading Logs" pages, as well as in http://ycprankings.awardspace.us/RankingTables.htm


Trading signal occurs in SELECT model portfolio: Sell FSNGX, Buy FSELX


Major indices rebounded this week to reach closely their record highs as the fear of  COVID omicron variant abated and the jobless claims reached the all time low.  S&P 500 index went up 3.82% to 4712, Dow Jones Industrial Average gained 4.02%, and the technology laden NASDAQ composite index increased 3.61% for the week. 

S&P 500 index rebounded from the trendline support to keep the uptrend alive. As the index tries to get back to its upper trading channel with lower momentum, we maintain our positive outlook with caution for the next few weeks.  


Weekly chart of S&P 500 index


Fund Rankings Update, 12/03/2021

Weekly Average Momentum Index (AMI) rankings of HSA, SSPP, RSP, SELECT, ETF, iETF, sETF have been posted in "Rankings", "Trading Logs" pages, as well as in http://ycprankings.awardspace.us/RankingTables.htm


Trading signal occurs in iETF model portfolio: Sell EWN, Buy IOO


Continued concern about the economic impact from COVID omicron variant and the news that Fed may tighten its money policy sooner because of the persistent inflation pressure pulled stocks down for the second week.  S&P 500 index went down 1.22% to 45384, Dow Jones Industrial Average lost 0.91%, and the technology laden NASDAQ composite index decreased 2.62% for the week. 

A cautious trading note was issued at the end of the blog last week as S&P 500 index showed a divergent pattern in its weekly chart, and the FEMKX timing system issued a sell signal. S&P 500 looks to be heading down to test its trend line support at 4400 while there is a stronger support below at 4200.  To continue its bull run, the index has to stay above its 28 week EMA trend line. The price action in the next couple of weeks will tell us if this consolidation will turn into a more severe correction. 

Again, we have reached the end of year when funds are distributing capital gains which affects the fund prices and momentum rankings. The distribution information are difficult to obtained beforehand, and I can only do my best to keep the data and rankings up-to-date.  Similar to the past years, the ranking information will not be as robust in the last few weeks of the year.


Weekly chart of S&P 500 index


Fund Rankings Update, 11/26/2021

Weekly Average Momentum Index (AMI) rankings of HSA, SSPP, RSP, SELECT, ETF, iETF, sETF have been posted in "Rankings", "Trading Logs" pages, as well as in http://ycprankings.awardspace.us/RankingTables.htm

Trading signal occurs in SSPP model portfolio: Sell FDEGX, Buy FDGRX
Trading signal occurs in sETF model portfolio: Sell IGV, Buy IEO
Trading signal occurs in FEMKX timing system: Sell FEMKX, Buy Cash


Fear of new variant of new corona virus triggered a sell-off Friday with Dow Jones Industrial Average plunged more than 900 points.  For this holiday shorten week, S&P 500 index went down 2.2% to 4594, Dow Jones Industrial Average lost 1.97%, and the technology laden NASDAQ composite index decreased 3.52%. 

Technical picture of S&P 500 index remains the same as the index is still consolidating along the upper end of the rising channer and the index is still above its trend line. However, our  FEMKX timing system issues a sell signal this week changing its holding to defensive cash position.  In addition, a  divergent pattern between the price and momentum indicator emerged in the weekly chart of S&P 500 index (price is making higher high while STO [15,1] is making lower high).  With these new signs, it is prudent to reduce the risk exposure.  


Weekly chart of S&P 500 index


Fund Rankings Update, 11/19/2021

 Weekly Average Momentum Index (AMI) rankings of HSA, SSPP, RSP, SELECT, ETF, iETF, sETF have been posted in "Rankings", "Trading Logs" pages, as well as in http://ycprankings.awardspace.us/RankingTables.htm


Stocks were mostly flat for the week with growth stocks outperformed value stocks. Positive economy data in October retail sales and manufacturing activity were balanced out by fear of high inflation data and rise in covid cases in some regions.  For the week, S&P 500 index went up 0.32% to 4697, Dow Jones Industrial Average lost 1.38%, while the technology laden NASDAQ composite index increased 1.24%. 

Technical picture of S&P 500 index remains the same as the index is consolidating along the upper end of the rising channer. 


Weekly chart of S&P 500 index


Fund Rankings Update, 11/12/2021

Weekly Average Momentum Index (AMI) rankings of HSA, SSPP, RSP, SELECT, ETF, iETF, sETF have been posted in "Rankings", "Trading Logs" pages, as well as in http://ycprankings.awardspace.us/RankingTables.htm


Major indices took a breather after 5 weeks of advance. Investor sentiment was weighed on by high inflation data released during the week but supported by the passage of the bipartisan infrastructure bill.   For the week, S&P 500 index went down 0.31% to 4682, Dow Jones Industrial Average lost 0.63%, and the technology laden NASDAQ composite index decreased 0.69%. 

S&P 500 index continued its upward trajectory along the upper trading channel as shown in the weekly chart below. We maintain our positive outlook that the index will continue heading higher for the coming weeks. 


Weekly chart of S&P 500 index


Fund Rankings Update, 11/05/2021

 Weekly Average Momentum Index (AMI) rankings of HSA, SSPP, RSP, SELECT, ETF, iETF, sETF have been posted in "Rankings", "Trading Logs" pages, as well as in http://ycprankings.awardspace.us/RankingTables.htm


Major indices continued to make record highs with tech sectors and small cap stocks leading the way.  Investor sentiments were boosted by the dovish statement from the Fed after its policy meeting Wednesday and the economic data showing better than expected factory orders in September. Job report released on Friday showing US added more than 530,000 jobs in September also supported the broad advance in stocks.  For the week, S&P 500 index went up 2.0% to 4697, Dow Jones Industrial Average gained 1.42%, and the technology laden NASDAQ composite index increased 3.05%. 

As shown in the weekly chart, S&P 500 index has comfortably broken above its previous high and reached the upward trajectory it has formed since November 2020. With the elevated momentum, we expect the index to continue heading higher for the coming weeks. 


Weekly chart of S&P 500 index


Fund Rankings Update, 10/29/2021

Weekly Average Momentum Index (AMI) rankings of HSA, SSPP, RSP, SELECT, ETF, iETF, sETF have been posted in "Rankings", "Trading Logs" pages, as well as in http://ycprankings.awardspace.us/RankingTables.htm


Stocks continued their advance with all major indices reaching all time high during the week.  Investor sentiments were supported by progress on President Biden's social infrastructure spending plan in the congress and the slow down in 3rd quarter GDP which bring down the intermedia- and long-term U.S. treasury yields.   Consumer discretionary sectors led the markets while energy sectors lagged.  For the week, S&P 500 index went up 1.33% to 4605, Dow Jones Industrial Average gained 0.4%, and the technology laden NASDAQ composite index increased 2.7%. 

S&P 500 reached all time high and closed the week above 4600.  The index has rebounded back from its 28 week EMA to its pre-September upward trajectory. We think the index will follow the trajectory going higher but need to remain vigilant about any future parabolic move. 


Weekly chart of S&P 500 index


Fund Rankings Update, 10/22/2021

 Weekly Average Momentum Index (AMI) rankings of HSA, SSPP, RSP, SELECT, ETF, iETF, sETF have been posted in "Rankings", "Trading Logs" pages, as well as in http://ycprankings.awardspace.us/RankingTables.htm


Boosted by positive earning surprise, stocks continued to march higher.  Utilities, health care and real estate sectors led the markets while communication and energy sectors lagged.  For the week, S&P 500 index went up 1.64% to 4544, Dow Jones Industrial Average gained 1.08%, and the technology laden NASDAQ composite index increased 1.29%. 

S&P 500 made the record high during the week but closed the week one point lower.  As mentioned in our last blog that we expect the index to reach all time high if it can hold the 4500 level. For the next few weeks, we think the index will resume its up trend with rising momentum.

Weekly chart of S&P 500 index


Fund Rankings Update, 10/15/2021

 Weekly Average Momentum Index (AMI) rankings of HSA, SSPP, RSP, SELECT, ETF, iETF, sETF have been posted in "Rankings", "Trading Logs" pages, as well as in http://ycprankings.awardspace.us/RankingTables.htm


Stocks continued its rebound boosted by positive economic data and strong earnings from banking sectors.  Consumer price went up 4% year over year at the end of September and Producer price index went up 0.5% in September indicating the peak of inflation might be over. Weekly jobless claim fell to 293000, a pandemic low and the September retail sales surprised the economists on the upside with 0.7% increase.   For the week, S&P 500 index went up 1.82% to 4471, Dow Jones Industrial Average gained 1.58%, and the technology laden NASDAQ composite index increased 2.18%. 

S&P 500 attempted to resume its uptrend and closed the week strongly above its 28 week EMA and the high of last week. Its daily momentum is heading upwards, and the daily MACD has shown a golden cross pattern. If the index can hold above 4500 next week, there is a great chance that it will advance further to make record high. The price action of S&P 500 index is very similar to what it had in the same period of time last year. It consolidated for two months in September and October, and broke out to resume its uptrend in November. We will see how the index performs in the next two weeks before November comes.     


Weekly chart of S&P 500 index


Daily chart of S&P 500 index


Fund Rankings Update, 10/8/2021

Weekly Average Momentum Index (AMI) rankings of HSA, SSPP, RSP, SELECT, ETF, iETF, sETF have been posted in "Rankings", "Trading Logs" pages, as well as in http://ycprankings.awardspace.us/RankingTables.htm


Trading signal occurs in SELECT model portfolio: Sell FSCSX, Buy FSNGX

Major stock indices went up this week recovering some of their loss from the previous week. Worries about U.S. debt ceiling at the beginning of the week subsided as Republicans and Democrats in the congress reached an agreement for temporarily lift the limit until December late in the week.  Energy sectors outperformed the markets as natural gas prices reached record high in Europe.  For the week, S&P 500 index went up 0.79% to 4391, Dow Jones Industrial Average gained 1.22%, and the technology laden NASDAQ composite index increased 0.09%. 

S&P 500 index bounced off its 28 week EMA for the third week as seen in the weekly chart below. The momentum indicator of the index has fallen below the over bought region and heading downward. If the index can stay above its trend line, there is a good chance that it will get back to its uptrend from here. We will see how the price action develops next week.  

A trading signal occurs in the SELECT model portfolio to sell FSCSX and buy the currently number one ranked fund, FSNGX as the rising interest rates continue to weaken the tech sectors, and natural gas prices rose due to seasonality effect.  Please see rankings tables and trading logs for more detail.  


Weekly chart of S&P 500 index


Fund Rankings Update, 10/01/2021

Weekly Average Momentum Index (AMI) rankings of HSA, SSPP, RSP, SELECT, ETF, iETF, sETF have been posted in "Rankings", "Trading Logs" pages, as well as in http://ycprankings.awardspace.us/RankingTables.htm


Trading signal occurs in sETF model portfolio: Sell ICF, Buy IGV

Fears about rising interest rates and Fed's tapering of its asset purchasing before the end of year, pushed the stocks downward. Interest rate sensitive technology sectors suffered the most with NASDAQ composite index leading the decline among the major indices.  September turns out to be the worst month since the beginning of the pandemic with S&P 500 index lost 4.8%, and lives up to its reputation as the weakest month of the year.   For the week, S&P 500 index went down 2.21% to 4451, Dow Jones Industrial Average lost 1.36%, and the technology laden NASDAQ composite index decreased 3.2%. 

S&P 500 index touched and bounced off its 28 week EMA the second week as seen in the weekly chart below. The momentum indicator of the index has fallen below the over bought region and heading downward, however, the index still stays above the trend line holding the up trend intact. Our outlook remain the same that we expect a couple more weeks of side way consolidation and a continuation of the up trend afterwards if the index mange to stay above the trend line.  

A trading signal occurs in the sETF model portfolio to sell ICF and buy the currently number one ranked fund, IGV as the rising interest pushed down the momentum ranking of realty index fund, ICF.  Please see rankings tables and trading logs for more detail.  


Weekly chart of S&P 500 index


Fund Rankings Update, 9/24/2021

Weekly Average Momentum Index (AMI) rankings of HSA, SSPP, RSP, SELECT, ETF, iETF, sETF have been posted in "Rankings", "Trading Logs" pages, as well as in http://ycprankings.awardspace.us/RankingTables.htm


Trading signal occurs in HSA model portfolio: Sell NBRIX, Buy MLAIX
Trading signal occurs in iETF model portfolio: Sell EWL, Buy EWN

After two consecutive down weeks, stocks recovered a bit with energy stocks outperformed the market.  Stocks plunged Monday in fear of the ripple effects to the global banking systems from the possible default of China's second largest real estate developer, Evergrande. Stocks regained most of the loss Wednesday as news about intervention from Chinese government surfaced.  For the week, S&P 500 index went up 0.51% to 4451, Dow Jones Industrial Average gained 0.62%, and the technology laden NASDAQ composite index increased 0.02%. 

A hammer candle stick pattern was formed this week in the weekly chart of S&P 500 index. The weekly candle has a short positive body and  a long lower wick which almost touches the 28 week moving average.  The index closed the week above the short term support of 4400 level that we have talked about in our last blog. As long as the index stays above its 28 week moving average, the up-trend is still intact. We expect to see a couple more weeks of side way consolidation and continuation of the up trend afterwards, if the index can mange to stay above the trend line.  

Two trading signals occurs in our model portfolios due to recent sector rotation and momentum ranking changes. The position in the HSA model portfolio is moving from real estate fund, NBRIX, to large cap growth fund, MLAIX after holding for 95 day. In the iETF model portfolio, the holding is changed from EWL to EWN after holding for 32 days. Please see rankings tables and trading logs for more detail.  


Weekly chart of S&P 500 index


Fund Rankings Update, 9/17/2021

Weekly Average Momentum Index (AMI) rankings of HSA, SSPP, RSP, SELECT, ETF, iETF, sETF have been posted in "Rankings", "Trading Logs" pages, as well as in http://ycprankings.awardspace.us/RankingTables.htm


Stocks ended lower for the second week. Worries about supplier chain challenge and the tightening monetary policy weighed in on investor sentiment.  However, economic data on inflation and retail sales released during the week surprised the analysts on the positive side. For the week, S&P 500 index went down 0.57% to 4432, Dow Jones Industrial Average lost 0.07%, and the technology laden NASDAQ composite index declined 0.47%. 

S&P 500 index declined for the second week but still follows the up trending trajectory since November 2020. 4400 level is a short term support while 4200 level around 28 week EMA and previous resistance is a more meaningful support level. The index is currently 4.3% above its 28 week EMA within our 5-6 % threshold so we do not see a large pulled back on the horizon.  Month of September is usually a weak month of the year for stocks according to seasonality.  We shall see how the index performs this year in two weeks when the month ends.  


Weekly chart of S&P 500 index

Fund Rankings Update, 9/10/2021

Weekly Average Momentum Index (AMI) rankings of HSA, SSPP, RSP, SELECT, ETF, iETF, sETF have been posted in "Rankings", "Trading Logs" pages, as well as in http://ycprankings.awardspace.us/RankingTables.htm


Trading signal occurs in SSPP model portfolio: Sell FRESX, Buy FDEGX
Trading signal occurs FEMKX timing model: Sell Cash, Buy FEMKX

Stocks ended lower this week as long term interest rate climbing higher. Worries about increasing spread of Delta variant of the coronavirus that hinders the economy recovery and the persistent high inflation rate that would force the Fed to tighten its monetary policy early also weighed in on investor sentiment.  For the week, S&P 500 index went down 1.69% to 4458, Dow Jones Industrial Average lost 2.15%, and the technology laden NASDAQ composite index decreased 1.61%. 

S&P 500 index has slowly moved upward following its trajectory since last November as shown in the weekly chart below. The index is still above its 28 week EMA with high momentum.  We expect it will continue to march higher with small consolidations along the way.  

Two trading signals were issued this week.  A buy signal from our FEMKX timing model was issued on this down week. The FEMKX timing model has been consistent in telling the market direction in the past and we shall see how it performs this time. Another trading signal was issued in SSPP model portfolio this week to sell real estate fund, FRESX, and buy the growth  related FDEGX fund due to rising longer interest rate. Readers can find the detail trading records in the trading log pages. 


Weekly chart of S&P 500 index


Fund Rankings Update, 9/3/2021

Weekly Average Momentum Index (AMI) rankings of HSA, SSPP, RSP, SELECT, ETF, iETF, sETF have been posted in "Rankings", "Trading Logs" pages, as well as in http://ycprankings.awardspace.us/RankingTables.htm


Stocks ended mixed this week as August job report showing U.S. only created 235,000 jobs well below the estimation of 750,000 jobs. Within the markets, small real estate sector outperformed while financial sectors lagged.  For the week, S&P 500 index went up 0.58% to 4535, Dow Jones Industrial Average lost 0.24%, and the technology laden NASDAQ composite index increased 1.55%. 


Weekly chart of S&P 500 index


Fund Rankings Update, 8/27/2021

Weekly Average Momentum Index (AMI) rankings of HSA, SSPP, RSP, SELECT, ETF, iETF, sETF have been posted in "Rankings", "Trading Logs" pages, as well as in http://ycprankings.awardspace.us/RankingTables.htm


Stocks continued to march higher with S&P 500 index and NASDAQ composite index making record high during the week. FDA's approval of Pfizer-BioNTech COVID-19 vaccine helped boosting the sentiment of continued economy recovery. Within the markets, small cap stocks outperformed its large cap counterparts with Technology and energy stocks leading the way.  For the week, S&P 500 index went up 1.52% to 4509, Dow Jones Industrial Average gained 0.96%, and the technology laden NASDAQ composite index increased 2.82%. 

S&P 500 index reached another record high and closed the week at 4509 above the 4500 psychological resistance. We have predicted the slow grinding upward pattern toward 4500 in the 7/2 blog, and we believe the pattern will continued for a while supported by the economy recovery and positive company earning outlook. 


Weekly chart of S&P 500 index


Fund Rankings Update, 8/20/2021

 Weekly Average Momentum Index (AMI) rankings of HSA, SSPP, RSP, SELECT, ETF, iETF, sETF have been posted in "Rankings", "Trading Logs" pages, as well as in http://ycprankings.awardspace.us/RankingTables.htm


Trading signal occurs in iETF model portfolio: Sell EWZ, Buy EWL


Stocks pulled back after S&P 500 index reached the all time high on Monday. Worries about Fed's tapering of asset purchases before the end of the year weighed in on investor sentiment. Small caps and energy related sectors underperformed the the general markets with Russel 2000 index fell more than 10% from its March high.  For the week, S&P 500 index went down 0.59% to 4441, Dow Jones Industrial Average lost 1.11%, and the technology laden NASDAQ composite index decreased 0.73%. 

S&P 500 index reached record high of 4480 on Monday before pulling back Tuesday and Wednesday. The index then bounced off the short term support of 4375 and closed the week at 4441. In the weekly chart below, the index still maintains its slow grinding upward pattern, and we expect it to continue that way.  A trading signal was issued in iETF model portfolio this week to move from energy related EWZ fund to the current number one ranked fund, EWL. EWZ was held for only a month with a loss of 7.9%. 


Weekly chart of S&P 500 index


Fund Rankings Update, 8/13/2021

Weekly Average Momentum Index (AMI) rankings of HSA, SSPP, RSP, SELECT, ETF, iETF, sETF have been posted in "Rankings", "Trading Logs" pages, as well as in http://ycprankings.awardspace.us/RankingTables.htm


Stocks edged higher for another week with senate passed the 1 Trillion bipartisan infrastructure bill and soon after senate Democrats passed the 3.5 trillion budget resolution. The mild July consumer price index also calmed the investors' fear about rampant inflation.  For the week, S&P 500 index went up 0.71% to 4468, Dow Jones Industrial Average gained 0.87%, while the technology laden NASDAQ composite index decreased 0.09%. 


Weekly chart of S&P 500 index


Fund Rankings Update, 8/6/2021

 Weekly Average Momentum Index (AMI) rankings of HSA, SSPP, RSP, SELECT, ETF, iETF, sETF have been posted in "Rankings", "Trading Logs" pages, as well as in http://ycprankings.awardspace.us/RankingTables.htm. 


Stocks advanced upward encouraged by positive company earning reports and employment report that US added 943K jobs in June well above expectation.  For the week, S&P 500 index went up 0.94% to 4436, Dow Jones Industrial Average gained 0.78%, and the technology laden NASDAQ composite index increased 1.11%. 

S&P 500 index continued its same upward trajectory with elevated momentum as shown in the weekly chart below.  Our positive short term outlook of the stock market stays the same as previous few weeks.   


Weekly chart of S&P 500 index


Fund Rankings Update, 7/30/2021

Weekly Average Momentum Index (AMI) rankings of HSA, SSPP, RSP, SELECT, ETF, iETF, sETF have been posted in "Rankings", "Trading Logs" pages, as well as in http://ycprankings.awardspace.us/RankingTables.htm. 


Stocks experienced higher volatility as companies including several tech giants reported their quarterly earnings during this busiest week of earning season. Major indices ended the week a tad lower after big gain last week. For the week, S&P 500 index went down 0.37% to 4395, Dow Jones Industrial Average lost 0.36%, and the technology laden NASDAQ composite index decreased 1.11%. 

The technical structure of S&P 500 index remains the same as it continued to march higher following the slope of its 28 week exponential moving average (EMA). With the slight decline this week, the index is 6.9% above its 28 EMA. Our view of market direction stays the same as last week: Without any foreseeable black swan event, we think the index will continue its current pattern moving higher with some fluctuation around its trend line.   


Weekly chart of S&P 500 index


Fund Rankings Update, 7/23/2021

 Weekly Average Momentum Index (AMI) rankings of HSA, SSPP, RSP, SELECT, ETF, iETF, sETF have been posted in "Rankings", "Trading Logs" pages, as well as in http://ycprankings.awardspace.us/RankingTables.htm. 


Trading signal occurs in SELECT model portfolio: Sell FSESX, Buy FSCSX.
Trading signal occurs in ETF model portfolio: Sell IYE, Buy IYW.
Trading signal occurs in sEFT timing system: Sell IEO, Buy ICF.


Stocks declined sharply Monday as fear of  the spread of delta COVID-19 variant  prevailed. However, stocks climbed back the rest of the week to reach another record high encouraged by positive company earnings and higher existing home sales.  Big tech stocks led the way for the fifth weeks while energy sectors lagged behind.  For the week, S&P 500 index went up 1.96% to 4411, Dow Jones Industrial Average gained 1.08%, and the technology laden NASDAQ composite index increased 2.84%. 

S&P 500 index continued to advance higher following its up-trending slope since November 2020. The index is 7.9% above its 28 week moving average and have been in this range for sometime. Although this deviation is greater than the historic norm, its price pattern has been very consistent without any large parabolic move. Without any foreseeable black swan event, we think the index will continue its current pattern moving higher with some fluctuation around its trend line.   

The comeback of technology sectors and the weakness of energy sectors have triggered the trading signals in the past three weeks. Three trading signals were issued in the model portfolios this week. Together with the three signals last week and the one before, seven out of our eight model portfolios have changed their positions due to sector rotations. Hopefully the momentum of the tech sectors can have more staying power to keep the up trend longer to improve the performance of the model portfolios. 


Weekly chart of S&P 500 index


Fund Rankings Update, 7/16/2021

Weekly Average Momentum Index (AMI) rankings of HSA, SSPP, RSP, SELECT, ETF, iETF, sETF have been posted in "Rankings", "Trading Logs" pages, as well as in http://ycprankings.awardspace.us/RankingTables.htm. 


Trading signal occurs in iETF model portfolio: Sell EWO, Buy EWZ.
Trading signal occurs in RSP model portfolio: Sell ARGFX, Buy FCNTX.
Trading signal occurs in FEMKX timing system: Sell FEMKX, Buy CASH.


Stocks ended the week lower in the quiet trading week. Small cap growth stocks further underperformed its large cap counterparts. This past week was the unofficial kick-off of the second quarter company earning reporting season. Additional trading volatility is expected in the next couple of weeks as usual.  For the week, S&P 500 index went down 0.97% to 4327, Dow Jones Industrial Average lost 0.52%, and the technology laden NASDAQ composite index decreased 1.87%. 

From weekly chart of S&P 500 index, the index is still trending upwards following the slope of its 28 week EMA and the momentum is still at an elevated level. The second chart below shows the weekly price patter of FEMKX which saw its momentum falling sharply in the past two weeks and caused a sell trading signal in the FEMKX timing system. FEMKX behaves more like small cap growth index (e.g. Russel 2000 index) than the large cap S&P 500 index. We have seen this kind of divergent between S&P 500 index and FEMKX in 2018.  At the time, S&P 500 index continued to march higher for 6 more months before plunging sharply while FEMKX slowly trended lower at the same time. With this FEMKX sell signal, caution is warranted and adjusting portfolio allocation to reduce risk level is recommended. 


Weekly chart of S&P 500 index


Weekly chart of FEMKX


Fund Rankings Update, 7/9/2021

Weekly Average Momentum Index (AMI) rankings of HSA, SSPP, RSP, SELECT, ETF, iETF, sETF have been posted in "Rankings", "Trading Logs" pages, as well as in http://ycprankings.awardspace.us/RankingTables.htm. 


Trading signal occurs in SSPP model portfolio: Sell FDVLX, Buy FRESX


Stocks edged up higher in this holiday shorten trading week. Large cap growth stocks outperformed small caps for the second weeks and the interest rate sensitive real estate sector led the gain as long term treasury yields fell sharply. For the week, S&P 500 index went up 0.4% to 4369, Dow Jones Industrial Average gained 0.24%, and the technology laden NASDAQ composite index increased 0.43%. 

A trading signal was issued in SSPP model portfolio this week to sell FDVLX and buy into FRESX as real estate sector has been gaining momentum in the last three months and the value stocks loosing the steam. The model portfolio has held FDVLX for 123 days with a gain of 10%.


Weekly chart of S&P 500 index


Fund Rankings Update, 7/2/2021

Weekly Average Momentum Index (AMI) rankings of HSA, SSPP, RSP, SELECT, ETF, iETF, sETF have been posted in "Rankings", "Trading Logs" pages, as well as in http://ycprankings.awardspace.us/RankingTables.htm. 


Stocks advanced higher with S&P 500 index and NASDAQ composite making another record high.  Economy data released during the week supported the positive sentiment with consumer confidence beating expectation and US economy added 850,000 jobs in June fare exceeded the 700,000 jobs expected. Within broader markets, large cap growth stocks outperformed small caps with tech and healthcare companies leading the way.  For the week, S&P 500 index went up 1.67% to 4352, Dow Jones Industrial Average gained 1.02%, and the technology laden NASDAQ composite index increased 1.94%. 

As observed in the weekly chart below, S&P 500 index has broken and stayed comfortably above its 4250 resistance level.  Our positive view of the market direction since two weeks ago stays the same as the index looks to be heading toward 4500. 


Weekly chart of S&P 500 index


Fund Rankings Update, 6/25/2021

Weekly Average Momentum Index (AMI) rankings of HSA, SSPP, RSP, SELECT, ETF, iETF, sETF have been posted in "Rankings", "Trading Logs" pages, as well as in http://ycprankings.awardspace.us/RankingTables.htm. 


Stocks advanced higher with S&P 500 index and NASDAQ composite making record high.  Investor sentiments were boosted by Fed Chair Jerome Powell's reiteration about recent spike in inflation as temporary on Tuesday, and the bipartisan agreement for Infrastructure deal reached on Thursday.  Energy stocks outperformed the market while real estate and utility stocks underperformed.  For the week, S&P 500 index went up 2.74% to 4280, Dow Jones Industrial Average gained 3.44%, and the technology laden NASDAQ composite index increased 2.35%. 

Both S&P 500 index and Nasdaq composite index moved higher and made record high this past week validating our view in the past few weeks. With both indices stay above their 28 week EMA with ascending momentum, we believe the indices will climb higher in the next few weeks. 


Weekly chart of S&P 500 index


Fund Rankings Update, 6/18/2021

 Weekly Average Momentum Index (AMI) rankings of HSA, SSPP, RSP, SELECT, ETF, iETF, sETF have been posted in "Rankings", "Trading Logs" pages, as well as in http://ycprankings.awardspace.us/RankingTables.htm. 


Trading signal occurs in HSA model portfolio: Sell NSVAX, Buy NBRIX
Trading signal occurs in SELECT model portfolio: Sell FSRBX, Buy FSESX
Trading signal occurs in ETF model portfolio: Sell IYT, Buy IYE


Major indices declined this week with DJIA suffered the most and NASDAQ composite index yield a small loss.  Federal reserve surprised the investor with a more hawkish stance in their post policy meeting Wednesday and Thursday announcement, as they see the inflation not as transitory as they originally thought and may raise interest rate sooner than anticipated. Tech and growth stocks outperformed the market with less decline wile cyclical and value stocks underperformed.  For the week, S&P 500 index went down 1.91% to 4166, Dow Jones Industrial Average lost 3.45%, and the technology laden NASDAQ composite index decreased 0.28%. 

S&P 500 index moved side way for another week hovering around 4200 while Nasdaq composite index tried to find its footing above 1400. The side way consolidation has improved the deviation of the S&P 500 index to its 28 week EMA from 10.8% in mid-April to 4.8% this past week. We expect the index will trending higher once the NASDAQ composite breaks its previous high of 14200 level next week. 

Two trading signals were issued in the HSA and SELECT model portfolios due to the recent sector rotation. In HSA model portfolio, a sell signal for NSVAX was issued and is replaced with NBRIX. The model portfolio has held NSVAX for 182 days with a gain of 19%. In the SELECT model portfolio, FSRBX will be replaced with FSESX.  As the momentum was not sustained, the FSRBX was  held only for 60 days with a loss of 4%.


Weekly chart of S&P 500 index


Weekly chart of NASDAQ composite index


Fund Rankings Update, 6/11/2021

 Weekly Average Momentum Index (AMI) rankings of HSA, SSPP, RSP, SELECT, ETF, iETF, sETF have been posted in "Rankings", "Trading Logs" pages, as well as in http://ycprankings.awardspace.us/RankingTables.htm. 


Trading signal occurs in sETF model portfolio: Sell IAT, Buy IEO


Tech stocks were pushed higher helped by the declining treasury bond yield through out the week as Fed indicated that they will continue the dovish monetary police for some time and the recent spike in inflation is temporary.  With the help from tech stocks, S&P 500 index reached all time high of 4249 on Thursday.   For the week, S&P 500 index went up 0.41% to 4247, Dow Jones Industrial Average lost 0.8%, and the technology laden NASDAQ composite index increased 1.85%. 

S&P 500 index moved side way with positive bias and reach the record high this past week as NASDAQ composite index broke above the 14000 psychological barrier. If Nasdaq composite index can solidify its footing above 14000 next week, we can see the uptrend that was paused since early April to resume.  An trading signal in sETF model portfolio was issued to sell IAT and buy the current number 1 AMI ranked IEO this week as the increasing energy prices pushed the related sectors higher. 


Weekly chart of S&P 500 index


Fund Rankings Update, 6/4/2021

Weekly Average Momentum Index (AMI) rankings of HSA, SSPP, RSP, SELECT, ETF, iETF, sETF have been posted in "Rankings", "Trading Logs" pages, as well as in http://ycprankings.awardspace.us/RankingTables.htm. 


Trading signal occurs in FEMKX timing system: Sell Cash, Buy FEMKX


Major indices ended the week a bit higher in this holiday shorten week.  Trading volume was still light with energy related stocks outperformed general markets.  US added 559K jobs in May less than expected but the unemployment rate ticked down from 6.1% to 5.8%. Bond rate fell back after the May job report indicating that investors expect Fed's monetary policy to remain accommodating.  For the week, S&P 500 index went up 0.61% to 4229, Dow Jones Industrial Average gained 0.66%, and the technology laden NASDAQ composite index increased 0.48%. 

S&P 500 index has gone side way for 7 weeks waiting for NASDAQ to break above the resistance at 1400. In the mean time, our FEMKX timing system, which has been a reliable indicator for market timing, has issued a buy signal as its momentum indicator STO[15,1] climbed above 50 shown in the weekly chart below. In the weekly chart, we can see FEMKX successfully tested its 28 week EMA in early May and broke above its resistance at 48 this week heading toward the previous high of $51.4. Readers can go to the trading log page to see the past performance of  FEMKX timing system, and we are looking forward to see how this buy signal perform in the future.


Weekly chart of S&P 500 index


Weekly chart of FEMKX

Fund Rankings Update, 5/28/2021

 Weekly Average Momentum Index (AMI) rankings of HSA, SSPP, RSP, SELECT, ETF, iETF, sETF have been posted in "Rankings", "Trading Logs" pages, as well as in http://ycprankings.awardspace.us/RankingTables.htm. 


Major indices ended the week broadly higher with growth stocks outperformed value stock.   For the week, S&P 500 index went up 1.16% to 4204, Dow Jones Industrial Average gained 0.94%, and the technology laden NASDAQ composite index increased 2.06%. 

S&P 500 index continued its side way consolidation while NASDAQ composite index continue its rebound after successfully tested the 28 week EMA as shown in the weekly charts below. Our technical outlook remains cautiously optimistic. As long as NASDAQ composite index does not fall below its 28 week EMA, we will see it slowly come back to resume its uptrend and carry S&P 500 index along with it. 


Weekly Chart of S&P 500 index


Weekly chart of NASDAQ composite index


Fund Rankings Update, 5/21/2021

Weekly Average Momentum Index (AMI) rankings of HSA, SSPP, RSP, SELECT, ETF, iETF, sETF have been posted in "Rankings", "Trading Logs" pages, as well as in http://ycprankings.awardspace.us/RankingTables.htm. 


Major indices ended the week mixed with lingering worries about rising interests but supported by strength of economy rebound.  For the week, S&P 500 index went down 0.43% to 4155, Dow Jones Industrial Average lost 0.51%, while the technology laden NASDAQ composite index increased 0.31%. 

S&P 500 closed the week a bit lower than where it began for another week of side way consolidation as observed in the weekly chart below. For NASDAQ composite index, this is the second week it successfully tested the 28 week EMA as shown in its weekly chart. The 28 week EMA has been a very strong support for NASDAQ composite index in the past. The index has held at this EMA support in November 2020, March 2021 and now. If NASDAQ composite index does not fall below its 28 EMA, we will see it slowly come back and resume its uptrend that was disrupted since mid-February. The rise of Nasdaq composite will also carry S&P 500 index along with it in our opinion. Interestingly, our FEMKX timing system, which has been a reliable market timing indicator, has been out of market since March 8 and has stayed on the sideline since as shown in the trading log page. At this stage, we have to patiently wait for the market development and take action accordingly. 
 

Weekly Chart of S&P 500 index

Weekly chart of NASDAQ composite index


Fund Rankings Update, 5/14/2021

 Weekly Average Momentum Index (AMI) rankings of HSA, SSPP, RSP, SELECT, ETF, iETF, sETF have been posted in "Rankings", "Trading Logs" pages, as well as in http://ycprankings.awardspace.us/RankingTables.htm. 


Trading signal occurs in ETF model portfolio: Sell IJS, Buy IYT


Major indices especially the interest rate sensitive NASDAQ composite index plunged this past Wednesday after inflation data released by Labor Department showing Consumer prices jumped 0.9 % in April and consumer prices index rose 4.2%, much higher than the 3.6% expected by economists.  NASDAQ went down to 1300, 9% below its previous high and Dow Jones Industrial Average plunged more than 600 points on Wednesday.  Stocks recovered partially Thursday and Friday, helped by the consensus that the spike in inflation data likely to be temporary.  For the week, S&P 500 index went down 1.39% to 4173, Dow Jones Industrial Average lost 1.14%, while the technology laden NASDAQ composite index decreased 2.34%. 

S&P 500 index continued its side way consolidation around 4200, while NASDAQ composite index went down to test its 28 week moving average as shown in the weekly charts below.  With momentum indicator of the NASDAQ composite index falling below 80 and heading downward, tech stocks seem to have a few more weeks of consolidation to go, which will cause the S&P 500 index to continue its side way consolidation for another few weeks in our opinion. 

Due to momentum change, a trading signal is issued this week in ETF model portfolio to move out of IJS and buy into IYT.  The model portfolio has help IJS for 105 days with a gain of 22%.


Weekly chart of S&P 500 index

Weekly chart of NASDAQ composite index


Fund Rankings Update, 5/7/2021

Weekly Average Momentum Index (AMI) rankings of HSA, SSPP, RSP, SELECT, ETF, iETF, sETF have been posted in "Rankings", "Trading Logs" pages, as well as in http://ycprankings.awardspace.us/RankingTables.htm. 


Worries about the economy "overheating" was calmed down somehow by the sharply less than expected job growth report.  US economy only added 266 thousand jobs in April way below the one million jobs expected by the economists. The disappointing job report helped to push the rising treasury yields down and boosted the beaten down tech stocks higher.  Value stocks outperformed growth stocks while tech stocks and consumer discretionary stocks underperformed despite strong quarterly earning reports. For the week, S&P 500 index went up 1.23% to 4232, Dow Jones Industrial Average gained 2.67%, while the technology laden NASDAQ composite index decreased 1.51%. 

S&P 500 index continued its steady climb and firmly closed above 4200. Investors are rotating out of growth stocks and move into value sectors due to seasonality (Sell in May and Go AWAY).  Our cautiously positive outlook remains the same as the past few weeks. 

Weekly chart of S&P 500 index


Fund Rankings Update, 4/30/2021

Weekly Average Momentum Index (AMI) rankings of HSA, SSPP, RSP, SELECT, ETF, iETF, sETF have been posted in "Rankings", "Trading Logs" pages, as well as in http://ycprankings.awardspace.us/RankingTables.htm. 


Major stock indices ended flat again this week. The positive sentiment due to economy rebound and strong quarterly company earnings was offset by concern about rising interest rate.  For the week, S&P 500 index went up 0.02% to 4181, Dow Jones Industrial Average lost 0.5%, and the technology laden NASDAQ composite index decreased 0.39%. 

S&P 500 index consolidated horizontally for the second week. This staircase arise is the preferable price movement that we would like to see for sustainable advance. Our cautiously positive outlook remains the same as last week. 


Weekly chart of S&P 500 index 


Fund Rankings Update, 4/23/2021

Weekly Average Momentum Index (AMI) rankings of HSA, SSPP, RSP, SELECT, ETF, iETF, sETF have been posted in "Rankings", "Trading Logs" pages, as well as in http://ycprankings.awardspace.us/RankingTables.htm. 


Trading signal occurs in sETF model portfolio: Sell IEZ, Buy IAT


Stocks took a breather with major indices ended the week flat.  Quarterly company earning reports and jobless claims during the week all indicated that the economy is transitioning back to post pandemic conditions. News about doubling the capital gain tax to fund President Biden's plan did rattle the investors' sentiment. However, stocks recovered some after investors' realization that with congress negotiation the increase won't be as high as what will be proposed.  For the week, S&P 500 index went down 0.13% to 4180, Dow Jones Industrial Average lost 0.46%, and the technology laden NASDAQ composite index decreased 0.25%. 

Instead of parabolic rise, S&P 500 index went side way this past week giving the 28 week EMA time to catch up.  It is the preferable price movement that we would like to see for sustainable advance. Our cautiously positive outlook remains the same as the index is still above its 28 week EMA and its momentum indicator still stay above 80. 

A trading signal occurs in sETF model portfolio this week to move from energy related IEZ to banking related IAT. This is consistent with the trading signal occurred last week for SELECT due to sector rotation. We have held IEZ for 126 days with gain of 7.38%.


Weekly chart of S&P 500 index


Fund Rankings Update, 4/16/2021

 Weekly Average Momentum Index (AMI) rankings of HSA, SSPP, RSP, SELECT, ETF, iETF, sETF have been posted in "Rankings", "Trading Logs" pages, as well as in http://ycprankings.awardspace.us/RankingTables.htm. 


Trading signal occurs in SELECT model portfolio: Sell FSESX, Buy FSRBX


Stocks advanced higher for another week with S&P 500 index and Dow Jones Industrial Average reaching record highs while the technology laden Nasdaq composite index and the small cap Russel 2000 index stay a bit below their all time highs.  Economic data for consumer spending, manufacturing activities and jobless claims released during the week all supported the positive investors sentiment, and the inflation data is tamed enough to temper the investors' anxiety for rising yields.  For the week, S&P 500 index went up 1.37% to 4185, Dow Jones Industrial Average gained 1.18%, and the technology laden NASDAQ composite index increased 1.09%. 

S&P 500 index continued to move higher and looks to be making a parabolic rise which we don't like to see.  The index is 10.8% above its 28 week moving average and caution is warranted going forward.  As this rally is driven by rebound in technology sectors and the NASDAQ composite index has not reached its previous high yet, we may still see the stocks going higher for another few weeks before some consolidation occur. 

A trading signal occurs this week in SELECT model portfolio to move from energy service sector fund, FSESX to banking sector fund, FSRBX, due to sector rotation. We have held FSESX for only 46 days with a loss of 14.8% as the fund can not maintains its upward momentum.
  

Weekly chart of S&P 500 index


Fund Rankings Update, 4/9/2021

Weekly Average Momentum Index (AMI) rankings of HSA, SSPP, RSP, SELECT, ETF, iETF, sETF have been posted in "Rankings", "Trading Logs" pages, as well as in http://ycprankings.awardspace.us/RankingTables.htm. 


Stocks advanced broadly higher boosted by the economic data that US has added more than 900K jobs in March, well above the expected 650K jobs. Big techs also came back in a big way with Apple, Microsoft, Google and Amazon all outperformed the market with more than 5% weekly gain.  For the week, S&P 500 index went up 2.71% to 4128, Dow Jones Industrial Average gained 1.95%, and the technology laden NASDAQ composite index increased 3.12%. 

S&P 500 index continued to advance to all time high after breaking the 4000 psychological barrier.  As technology laden Nasdaq composite index is reversing its downtrend and heading higher, the S&P 500 index will be boosted and resume its uptrend. We expect the market will head higher but need to watch out for the parabolical rise.  


Weekly chart of S&P 500 index


Fund Rankings Update, 4/2/2021

Weekly Average Momentum Index (AMI) rankings of HSA, SSPP, RSP, SELECT, ETF, iETF, sETF have been posted in "Rankings", "Trading Logs" pages, as well as in http://ycprankings.awardspace.us/RankingTables.htm. 


Stocks advanced higher as the first quarter came to an end and the second quarter begins. S&P 500 index broke above the 4000 barrier and close at all time high of 4019.  Investor sentiments were boosted by President Biden's two trillion infrastructure plan which will vastly increase spending on internet and transportation infrastructure as well as on research and development. Economic data released during the week also supported investors' optimism with consumer confidence index reaching record high and regional manufacturing indexes surprised economists on the upside.  For the week, S&P 500 index went up 1.14% to 4019, Dow Jones Industrial Average gained 0.24%, and the technology laden NASDAQ composite index increased 2.6%. 

S&P 500 index broke the 4000 psychological barrier and closed the week at 4019.  As we discussed in the blog last week: Now that the Nasdaq composite index has found a support above its 28 week moving average and about to reverse its downward direction, the S&P 500 will complete its flat consolidation and resume its advance. Going forward, the best scenario is for the index to make small but steady advances with flat consolidations along the way, while the worst scenario is for the index to make hyperbolic jumps and crash down heavily.  Regardless of how this is playing out, we just have to be patient and execute our trades according to the plan.  


Weekly chart of S&P 500 index


Fund Rankings Update, 3/26/2021

Weekly Average Momentum Index (AMI) rankings of HSA, SSPP, RSP, SELECT, ETF, iETF, sETF have been posted in "Rankings", "Trading Logs" pages, as well as in http://ycprankings.awardspace.us/RankingTables.htm. 


Major indices ended the week mixed with optimism about reopening of the economy outweighing concern about the rising interest rates.  For the week, S&P 500 index went up 1.57% to 3974, Dow Jones Industrial Average gained 1.36%, while the technology laden NASDAQ composite index decreased 0.58%. 

Weekly charts below show that S&P 500 index continued its side way consolidation  the past two weeks while the NASDAQ composite index retested its 28 week moving average support. The momentum indicator, STO[15,1], of S&P 500 index has climbed back to overbought position and headed higher, while momentum indicator of NASDAQ composite index has slowed down its downward falling near 50, and appears to turn around if we can get a positive close next week.  As we have discussed last week that this consolidation has been concentrated on tech sectors and growth stocks. It is likely that the general market will resume its up trend once the tech sector consolidation is over. We will see how this play out next week.  


Weekly chart of S&P 500 index


Weekly chart of NASDAQ composite index