Weekly Average Momentum Index (AMI) rankings of HSA, SSPP, RSP, SELECT, ETF, iETF, and sETF have been posted on "Rankings", and "Trading Logs" pages, as well as in http://ycprankings.awardspace.us/RankingTables.htm.
Trading signal occurs in sETF model portfolio: Sell IAT, Buy ITB.
Trading signal occurs in FEMKX timing system: Sell Cash, Buy FEMKX.
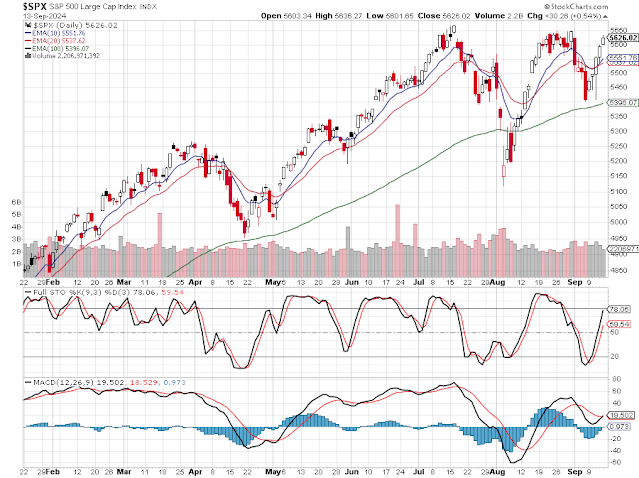
The stock market continued its upward trend this week, with the S&P 500 index and Dow Jones Industrial Average reaching new record highs. The economic news released during the week showed both softness in economic growth and the tameness in inflation. The U.S. consumer confidence index fell sharply to 98.7 in August, the lowest level in two years, and new home sales declined 4.7% in August, although not as much as expected. On Friday, the Commerce Department reported that the core personal consumer expenditures (PCE) price index, rose only 0.1% in August. The index climbed only 2.2% yearly, close to the Fed’s 2.0% long-term inflation target. For the week, The S&P 500 gained 0.62%, closing at 5738, the Dow Jones Industrial Average advanced 0.59%, and the Nasdaq composite index increased 0.95%.
The S&P 500 index has maintained its strong upward trajectory. Our bullish stance remains unchanged: We anticipate further gains, and any pullback to the 10-day or 20-day moving averages on the daily chart should be considered potential buying opportunities.
 |
| The weekly chart of the S&P 500 index |


