Fund Rankings Update, 6/13/2014

Weekly Average Momentum Index (AMI) rankings of HSA, SSPP, RSP, SELECT, ETF, iETF, sETF have been posted at "Rankings", "Trading Logs" pages, and  http://ycprankings.awardspace.us/RankingTables.htm.


After three weeks of moving higher, stocks took a pause to digest their gain. Turmoil in Ukraine and Iraq weighed on investors' mind as well. S&P 500 index closed at 1936, down 0.68%, Dow Jones Industrial Average lost 0.88%, and Nasdaq composite decrease 0.25% for the week.   

For intermediate term trend, S&P 500 index is still moving upward with high momentum as shown in the weekly chart. However, in the daily chart, the index has come down from its high with decreasing momentum. It looks like S&P 500 index will test the 1900 support and resume its advancement if the test is successful. 

In the US sectors, energy related sector funds have dominated the ranking tables due to higher oil prices resulted from conflict in Iraq and Ukraine. In the global arena, India has been strong as well as Brazil which is buoyed by the world cup soccer.  

Weekly Chart of S&P 500 Index

Daily Chart of S&P 500 Index

Fund Rankings Update, 6/6/2014

Weekly Average Momentum Index (AMI) rankings of HSA, SSPP, RSP, SELECT, ETF, iETF, sETF have been posted at "Rankings", "Trading Logs" pages, and  http://ycprankings.awardspace.us/RankingTables.htm.


With European Central Bank (ECB) started to ease its money policy and good US economy data, stocks propelled to new high. S&P 500 index closed at 1949, up 1.34%, Dow Jones Industrial Average gained 1.24%, while Nasdaq composite increased 1.86% for the week.   

Stocks continue to gain momentum. S&P 500 index and Nasdaq composite are expected to advance higher. Next resistance level for S&P 500 index is the psychological barrier of 2000 and for NASDAQ, the previous high of 4370.  


Weekly Chart of S&P 500 Index

Weekly Chart of NASDAQ Composite Index

Fund Rankings Update, 5/30/2014

Weekly Average Momentum Index (AMI) rankings of HSA, SSPP, RSP, SELECT, ETF, iETF, sETF have been posted at "Rankings", "Trading Logs" pages, and  http://ycprankings.awardspace.us/RankingTables.htm.


First quarter US GDP was revised down from positive 0.1% to negative 1% but economists and investors expect economy to pick up steam in the second quarter. Riding the expectation, major indices advanced for the second week.  S&P 500 index closed at 1923, up 1.21%, Dow Jones Industrial Average gained 0.67%, while Nasdaq composite increased 1.36% for the week.   

S&P 500 index broke above the psychological barrier of 1900, and Nasdaq composite has rebounded nicely from its 28 week moving average. Momentum of both indices have picked up and we expect the rally to continue for at least another few weeks.

Weekly Chart of S&P 500 Index

Weekly Chart of NASDAQ Composite Index


Fund Rankings Update, 5/23/2014

Weekly Average Momentum Index (AMI) rankings of HSA, SSPP, RSP, SELECT, ETF, iETF, sETF have been posted at "Rankings", "Trading Logs" pages, and  http://ycprankings.awardspace.us/RankingTables.htm.


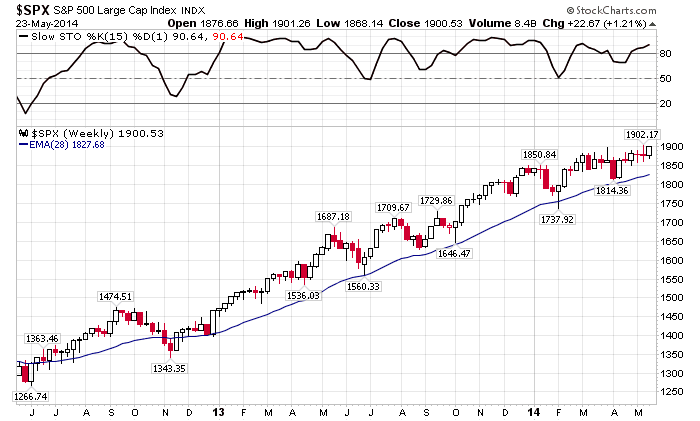
Major indices rose for the week boosted by rebounds in technology sectors and small cap stocks.  S&P 500 index closed at 1900, up 1.21%, Dow Jones Industrial Average gained 0.7%, while Nasdaq composite increased 2.33% for the week.   

S&P 500 index advanced to the top the trading channel and stands at the psychological barrier of 1900. It appears that the rally is slowly taking shape at a slower growth rate as we have discussed a few weeks ago. Seven weeks ago, we saw S&P 500 index approached the same level but failed to break above it. At that time, the technology and small cap sectors were in a selling correction phase. Without broad based market support, S&P 500 index fell and went side way since. This time, Nasdaq composite index is rebounding from the support and gaining momentum as observed in its weekly chart. With broad based market support, S&P 500 index looks to be able to break the 1900 level and keep the rally going.


Weekly Chart of S&P 500 Index

Weekly Chart of NASDAQ Composite Index

Fund Rankings Update, 5/16/2014

Weekly Average Momentum Index (AMI) rankings of HSA, SSPP, RSP, SELECT, ETF, iETF, sETF have been posted at "Rankings", "Trading Logs" pages, and  http://ycprankings.awardspace.us/RankingTables.htm.


Stocks closed mix again this past week.  S&P 500 index closed at 1877, down 0.03%, Dow Jones Industrial Average lost 0.55%, while Nasdaq composite increased 0.46% for the week.   

Technical picture for S&P 500 index and Nasdaq composite index remain the same as last week. In the weekly charts below, S&P 500 index is still in the flat consolidation mode while Nasdaq composite index manages to stay above its 28 week MA. So far, we have considered this as a healthy consolidation so long as the indices do not fall below their support levels.  


Weekly Chart of S&P 500 Index


Weekly Chart of Nasdaq Composite Index


Fund Rankings Update, 5/9/2014

Weekly Average Momentum Index (AMI) rankings of HSA, SSPP, RSP, SELECT, ETF, iETF, sETF have been posted at "Rankings", "Trading Logs" pages, and  http://ycprankings.awardspace.us/RankingTables.htm.


Trading signal occurs in ETF model portfolio: Sell IGN, Buy EZA.

Stocks were mix with upbeat economy data for manufacturing activity and weekly jobless claim advanced large cap stocks while rotation away from momentum stocks pulled down the small cap stocks.  S&P 500 index closed at 1878, down 0.14%, Dow Jones Industrial Average gained 0.43%, and Nasdaq composite decreased 1.26% for the week.   

As observed in the weekly charts, S&P 500 index is still in the flat consolidation mode while Nasdaq composite index is trying to stay above its 28 week MA and looking for a bounce. Technically, these consolidation is healthy as long as the indices stay above their support level.  

Sector rotation has bee observed from our AMI ranking tables. Investors have rotated out of the technology sectors and moved into energy related sectors. Last week we had trading signal in sETF to move out of the networking IGN and trade into energy exploration IEO. This week, a trading signal was issued in ETF model portfolio to sell IGN and buy into Brazil country fund, EZA, which closely related to natural resource. 


Weekly Chart of S&P 500 Index
Weekly Chart of Nasdaq Composite Index

Fund Rankings Update, 5/2/2014

Weekly Average Momentum Index (AMI) rankings of HSA, SSPP, RSP, SELECT, ETF, iETF, sETF have been posted at "Rankings", "Trading Logs" pages, and  http://ycprankings.awardspace.us/RankingTables.htm.


Trading signal occurs in sETF model portfolio: Sell IGN, Buy IEO.

Strong company earnings continued to push stock prices higher with seventy four  percent of the companies in S&P 500 index reported better than expected earnings.  S&P 500 index closed at 1881, up 0.95%, Dow Jones Industrial Average gained 0.93%, and Nasdaq composite increased 1.19% for the week.   

We may see some short term bounce in the coming weeks as all three major indices showed momentum picking up in both weekly charts and daily charts. The uptrend has not been disrupted as long as the indices all hold above their 28 week moving average. However, we expect the growth rate to be slower than before since sector leadership has changed toward defensive and energy related sectors as technology sectors faded away. 


Weekly chart of S&P 500 Index


Weekly Chart of NASDAQ Composite Index