Fund Rankings Update, 9/19/2014

Weekly Average Momentum Index (AMI) rankings of HSA, SSPP, RSP, SELECT, ETF, iETF, sETF have been posted at "Rankings", "Trading Logs" pages, and  http://ycprankings.awardspace.us/RankingTables.htm.


Trading signal occurs in SSPP model portfolio: Sell FICDX, buy FOCPX.
Trading signal occurs in FEMKX model portfolio: Sell FEMKX, buy CASH.

Investors felt relief as FED keep the easy money policy in place on Wednesday. They were also calmed by the "no" vote in Scottish independence referendum to break out from United Kindom on Friday.  S&P 500 index rose above 2000 level and closed at 2010, up 1.25%. Dow Jones Industrial Average gained 1.72%, and Nasdaq composite index increased 0.27% for the week.   

In the weekly chart, S&P 500 index is still flirting around the 2000 level. It will be interesting to see if the index can continue to advance next week and truly break out from the 2000 level. On the other hand, it may test the short term support at 1950 which we have mentioned last week if the break out fails. 

Two trading signals were issued this week. In SSPP model portfolio, FICDX is replaced with FOCPX due to AMI rank change. FICDX was bought in July when energy related sectors were outperforming others. However, the trend doese not sustain long engough and we have held FICDX for 74 days with a loss of 0.47%.  For FEMKX timing system, the STO indicator has dropped to 54 below the selling threshold and a trading signal is issued to move to cash position.  The model portfolio has held the fund since March for 200 days with a gain of 10.54%. 

Weekly chart of S&P 500 index

Fund Rankings Update, 9/12/2014

Weekly Average Momentum Index (AMI) rankings of HSA, SSPP, RSP, SELECT, ETF, iETF, sETF have been posted at "Rankings", "Trading Logs" pages, and  http://ycprankings.awardspace.us/RankingTables.htm.


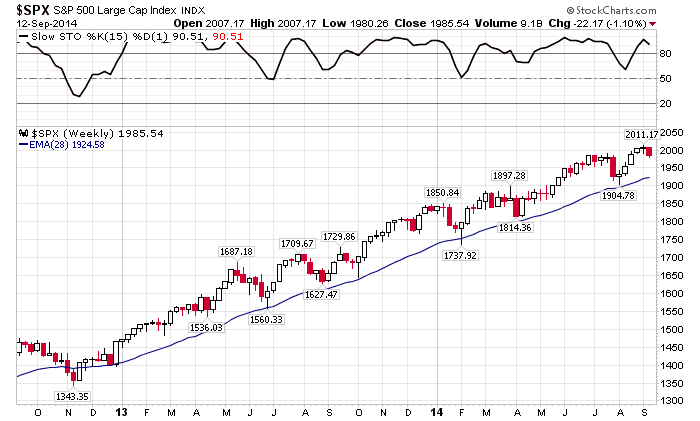
With no major economic data weighing in on the markets, stocks finally took a break after gaining for five weeks.  S&P 500 index fell below 2000 level and closed at 1985, down 1.1%. Dow Jones Industrial Average lost 0.87%, and Nasdaq composite index decreased 0.33% for the week.   

In the weekly chart, S&P 500 index is still struggling around the 2000 level waiting for breakout. On the down side, a short term support around 1950- 1960 level can provide some buying opportunity if the rally holds.

Weekly chart of S&P 500 index

Fund Rankings Update, 9/5/2014

Weekly Average Momentum Index (AMI) rankings of HSA, SSPP, RSP, SELECT, ETF, iETF, sETF have been posted at "Rankings", "Trading Logs" pages, and  http://ycprankings.awardspace.us/RankingTables.htm.


Trading signal occurs in HSA model portfolio: Sell TVAFX buy OPMYX

Mixed economic news with strong manufacturing and service sector data and weak employment data ease investors' fear of FED's rate hike. News about cease fire agreement in Ukraine also help the market to elk out a small gain.  S&P 500 index stands at 2007, up 0.22%. Dow Jones Industrial Average gained 0.23%, and Nasdaq composite index increased 0.06% for the week.   

Technical picture of S&P 500 index remains the same as last week. The index is trying to consolidate above 2000 for the second week waiting for the trend line to catch up while daily and weekly momentum stay high.

Growth funds have outpaced valued funds in the past couple of months. A trading signal occurs in HSA model portfolio was issued to sell TVAFX which has fell to 7 in the momentum ranking table. We will replace the fund with the current number one ranked fund, OPMYX (see detail in Ranking and Trading Log pages). The model portfolio has held TVAFX for 263 days with a gain of 13.4%.

Weekly chart of S&P 500 index

Fund Rankings Update, 8/29/2014

Weekly Average Momentum Index (AMI) rankings of HSA, SSPP, RSP, SELECT, ETF, iETF, sETF have been posted at "Rankings", "Trading Logs" pages, and  http://ycprankings.awardspace.us/RankingTables.htm.


Positive economic data in 2nd quarter GDP out weighed the geopolitical tension in Ukraine this past week.  S&P 500 index stands at 2003, up 0.75%. Dow Jones Industrial Average gained 0.57%, and Nasdaq composite index increased 0.92% for the week.   

As shown in the weekly chart, S&P 500 index has resumed its up trend and reached the all time record high of 2000. It broke through 2000 on Monday and spent the next four days successfully defended the position.  As 2000 is an all time record high and a round number, we expect it to be a heavier psychological resistance and may cause more consolidation action. However, both daily and weekly momenta of the index are still heading higher, the intermediate up trend should stay intact.


Weekly chart of S&P 500 index

Fund Rankings Update, 8/22/2014

Weekly Average Momentum Index (AMI) rankings of HSA, SSPP, RSP, SELECT, ETF, iETF, sETF have been posted at "Rankings", "Trading Logs" pages, and  http://ycprankings.awardspace.us/RankingTables.htm.


Encouraged by strong economic data on housing starts and manufacturing activity, stocks advanced broadly this past week.  S&P 500 index stands at 1988, up 1.71%. Dow Jones Industrial Average gained 2.03%, and Nasdaq composite index increased 1.65% for the week.   

S&P 500 index continued its rebound from the 28 week moving average as shown in the weekly chart. The weekly momentum indicator, STO, has stopped falling and headed back up. The up trend since January 2013 has resumed and is expected to last for a while.

Weekly Chart of S&P 500 Index

Fund Rankings Update, 8/15/2014

Weekly Average Momentum Index (AMI) rankings of HSA, SSPP, RSP, SELECT, ETF, iETF, sETF have been posted at "Rankings", "Trading Logs" pages, and  http://ycprankings.awardspace.us/RankingTables.htm.


Stocks continued its rebound amid summer's light trading.  S&P 500 index stands at 1955, up 1.22%. Dow Jones Industrial Average gained 0.66%, and technology loaded Nasdaq composite index increase 2.15% for the week.   

S&P 500 index, following the past pattern, rebounded from trend line after forming a long tail candle in the weekly chart (see last week's blog). In the daily chart, the index has climbed back to its 50 day moving average, the STO indicator is crossing above 50, and the MACD has turned positive. As stated last week, investors who can tolerate higher risk level can start buying into the market to catch the next wave up. 

Weekly chart of SP 500 index

Daily chart of S&P 500 index

Fund Rankings Update, 8/8/2014

Weekly Average Momentum Index (AMI) rankings of HSA, SSPP, RSP, SELECT, ETF, iETF, sETF have been posted at "Rankings", "Trading Logs" pages, and  http://ycprankings.awardspace.us/RankingTables.htm.

Trading signal occurs in ETF model portfolio: Sell IGE, Buy FXI.
Trading signal occurs in RSP model portfolio: Sell 05087 (LSV LGE CP VALUE EQ), Buy 42625 (SSGA EMRG MKTS INDEX).

After sell-off a week before, markets tried to stabilize and manged to elk out a small gain amid lingering geopolitical tension and worries about European economic growth.  S&P 500 index climbed a bit to 1931, up 0.33%. Dow Jones Industrial Average gained 0.37%, and technology loaded Nasdaq composite index increase 0.42% for the week.   

Last week we talked about long tailed candled bounced off from trend line in weekly chart of S&P 500 index. As shown in the chart below, the long tail candle with the tip nearly touching the trend line. If the past pattern holds up, we should see the index turning around in the next week or two.  In the daily chart, the stochastic oscillator (STO) and MACD are turning around, and traders can start taking positions in the markets when daily STO climbs back above 20 and MACD histogram (blue number in the chart) becomes positive. 

The consolidation and sell-off have caused the sector rotation as traders and investors adjusted their portfolio to reduce the risk exposure. After last week's trading signal in sETF, we have two trading signals issued this week. In the ETF model portfolio, we change the position from engergy related IGE to China ETF fund, FXI, due to its economy recovery. In the RSP model portfolio, we are changing position from large cap fund, 05087 to emerging market index, 42627. We have held IGE for only 32 days with 4.12% loss and have held 05087 for 123 days with a gain of 2.88%.


Weekly Chart of S&P 500 Index

Daily Chart of S&P 500 Index