 |
| Weekly chart of S&P 500 index |
Fund Rankings Update, 9/28/2018
Weekly Average Momentum Index (AMI) rankings of HSA, SSPP, RSP, SELECT, ETF, iETF, sETF have been posted in "Rankings", "Trading Logs" pages, and http://ycprankings.awardspace.us/RankingTables.htm.
The third quarter comes to an end this weekend as institution investors dressed up their investment portfolios before quarterly reporting. Note that stocks has gone up 7.2% this quarter, the strongest performance since 2013. On the economy front, Federal Reserved raised Fed fund rate by 0.25% as expected on Wednesday and the Fed is expected to continue raising interest rate every quarter by 0.25% though next year due to strong economic growth. Major stock indices closed the week mixed with technology and consumer discretionary sectors leading the markets while material and financial sectors lagging. For the week, S&P 500 index closed at 2913 down 0.54%, Dow Jones Industrial Average lost 1.07% while technology laden NASDAQ composite index increased 0.74%.
Weekly chart of S&P 500 index shows a very robust uptrend along the top of its trending channel. With high momentum and low volatility, we expect the the index to keep trending up in the fourth quarter.
Fund Rankings Update, 9/21/2018
Weekly Average Momentum Index (AMI) rankings of HSA, SSPP, RSP, SELECT, ETF, iETF, sETF have been posted in "Rankings", "Trading Logs" pages, and http://ycprankings.awardspace.us/RankingTables.htm.
Stocks continued to march higher as investors were encouraged by positive economic data in jobless claim, and regional manufacturing activities. Escalation of trade tension between US and China did not sway the mood in the markets. However, technology sectors and small cap stocks under-performed the markets and recorded a small loss. For the week, S&P 500 index closed at 2929 up 0.85%, Dow Jones Industrial Average gained 2.25% while technology laden NASDAQ composite index decreased 0.29%.
Weekly chart of S&P shows a steady up rise trend since July. It has gone up from 2700 to 2950, a 9% increase in less than 3 months. The index still posses a very high momentum, and the uptrend appears to be intact. We expect the index to keep marching higher and don't expect change in the market direction in the near future.
 |
| Weekly chart of S&P 500 index |
Fund Rankings Update, 9/14/2018
Weekly Average Momentum Index (AMI) rankings of HSA, SSPP, RSP, SELECT, ETF, iETF, sETF have been posted in "Rankings", "Trading Logs" pages, and http://ycprankings.awardspace.us/RankingTables.htm.
Stocks rebounded from last week's decline. Investors' sentiment was largely affected by the mixed trade signals with China from White House. Technology sector outperformed the general markets just as they led the way down last week. For the week, S&P 500 index closed at 2904 up 1.16%, Dow Jones Industrial Average gained 0.92% and technology laden NASDAQ composite index increased 1.36%.
 |
| Weekly chart of $&P 500 index |
Fund Rankings Update, 9/7/2018
Weekly Average Momentum Index (AMI) rankings of HSA, SSPP, RSP, SELECT, ETF, iETF, sETF have been posted in "Rankings", "Trading Logs" pages, and http://ycprankings.awardspace.us/RankingTables.htm.
Trading signal occurs in iETF model portfolio: Sell EWC, Buy IOO
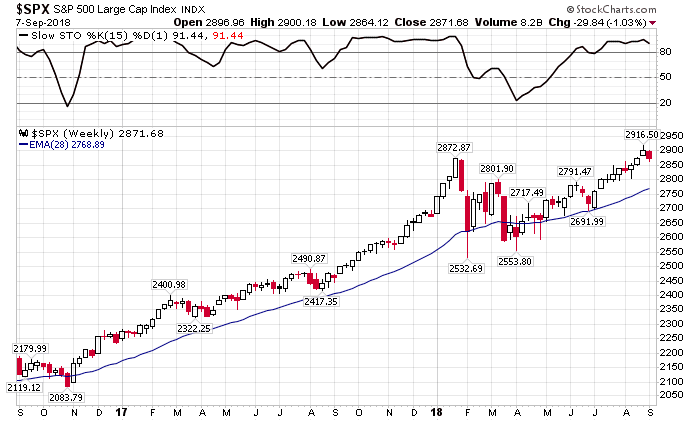
Uncertainty about trade talk with Canada and talk about another round of tariffs on China goods weighed on investors' sentiment. Technology sector leading the decline after executives from Facebook and Twitter testified in front of congress about information integrity. For the week, S&P 500 index closed at 2871 down 1.03%, Dow Jones Industrial Average lost 0.19% and technology laden NASDAQ composite index decreased 2.55%.
S&P 500 index digested its gain from the past three week as seen in the weekly chart. The healthy pull back keeps the index from over extension and back to the middle of the uptrend established in late 2016. We expect the index to keep trending higher as the technical pattern of the index stay the same with high momentum and low volatility.
Uncertainty about trade talk with Canada and talk about another round of tariffs on China goods weighed on investors' sentiment. Technology sector leading the decline after executives from Facebook and Twitter testified in front of congress about information integrity. For the week, S&P 500 index closed at 2871 down 1.03%, Dow Jones Industrial Average lost 0.19% and technology laden NASDAQ composite index decreased 2.55%.
 |
| Weekly chart of $&P 500 index |
S&P 500 index digested its gain from the past three week as seen in the weekly chart. The healthy pull back keeps the index from over extension and back to the middle of the uptrend established in late 2016. We expect the index to keep trending higher as the technical pattern of the index stay the same with high momentum and low volatility.
Fund Rankings Update, 8/31/2018
Weekly Average Momentum Index (AMI) rankings of HSA, SSPP, RSP, SELECT, ETF, iETF, sETF have been posted in "Rankings", "Trading Logs" pages, and http://ycprankings.awardspace.us/RankingTables.htm.
Encouraged by the revised trade agreement between Mexico and U.S., as well as the optimism that a trade agreement between U.S. and Canada will soon to follow, stocks moved decisively higher with technology sector leading the ways. For the week, S&P 500 index closed at 2901 up 0.93%, Dow Jones Industrial Average gained 0.68% and technology laden NASDAQ composite index increased 2.06%.
With high momentum and 2850 resistance level broken, S&P 500 moved higher to another record high as we have anticipated in last week's blog. The index is now 5% above its 28 week moving average. Caution needs to be taken when the index is too far above its support line. Looking back in January, a correction occurred when the index is more than 9% above its trend line. We are not at that extreme level yet, and we will pay close attention to the price movement when the index is more than 6% higher above its 28 week moving average.
 |
| Weekly chart of S&P 500 index |
Fund Rankings Update, 8/24/2018
Weekly Average Momentum Index (AMI) rankings of HSA, SSPP, RSP, SELECT, ETF, iETF, sETF have been posted in "Rankings", "Trading Logs" pages, and http://ycprankings.awardspace.us/RankingTables.htm.
Stocks advanced to record high with tech and energy sector leading the ways. Strong economic fundamental out weighed the political turmoil at the White House. For the week, S&P 500 index closed at 2874 up 0.86%, Dow Jones Industrial Average gained 0.47% and technology laden NASDAQ composite index increased 1.66%.
After four weeks of attempts to break the short term resistance at 2850, S&P 500 finally overcame the resistance decisively and closed at a record high of 2874. As the resistance level is been taken down, we expect the index to keep climbing higher.
 |
| Weekly chart of S&P 500 index |
Fund Rankings Update, 8/17/2018
Weekly Average Momentum Index (AMI) rankings of HSA, SSPP, RSP, SELECT, ETF, iETF, sETF have been posted in "Rankings", "Trading Logs" pages, and http://ycprankings.awardspace.us/RankingTables.htm.
Trading signal occurs in sETF model portfolio: Sell IEO, Buy IHF
Concern about global economy growth due to Turkish currency crisis weighed on investor sentiment at the beginning of the week. However, stocks got a lift Thursday from news about US and China to resume trade talk in November. For the week, S&P 500 index closed at 2850 up 0.59%, Dow Jones Industrial Average gained 1.41% while technology laden NASDAQ composite index decreased 0.29%.
S&P 500 index made a fourth attempt to break above 2850 resistance level this week. The index has traded between 2800 and 2850 for five weeks. As its momentum is still in the top tier region, we still think the index will move higher. However, we need to pay attention if the index fails to break the 2850 resistance and forms a short term rounded top formation.
A trading signal was issued this week in sETF model portfolio to sell energy sector related index fund, IEO, and buy health care related fund, IHF. Health care related sectors have performed very strongly in the last 4 weeks, which can be seen in both "Select" and "sETF" ranking tables. IEO failed to maintain its momentum longer and we will sell it after holding it for 102 days with a slight loss. Hopefully IHF has a more staying power and can turn into a winning trade.
Concern about global economy growth due to Turkish currency crisis weighed on investor sentiment at the beginning of the week. However, stocks got a lift Thursday from news about US and China to resume trade talk in November. For the week, S&P 500 index closed at 2850 up 0.59%, Dow Jones Industrial Average gained 1.41% while technology laden NASDAQ composite index decreased 0.29%.
 |
| Weekly chart of S&P 500 index |
A trading signal was issued this week in sETF model portfolio to sell energy sector related index fund, IEO, and buy health care related fund, IHF. Health care related sectors have performed very strongly in the last 4 weeks, which can be seen in both "Select" and "sETF" ranking tables. IEO failed to maintain its momentum longer and we will sell it after holding it for 102 days with a slight loss. Hopefully IHF has a more staying power and can turn into a winning trade.
Subscribe to:
Posts (Atom)