Fund Rankings Update, 6/25/2021

Weekly Average Momentum Index (AMI) rankings of HSA, SSPP, RSP, SELECT, ETF, iETF, sETF have been posted in "Rankings", "Trading Logs" pages, as well as in http://ycprankings.awardspace.us/RankingTables.htm. 


Stocks advanced higher with S&P 500 index and NASDAQ composite making record high.  Investor sentiments were boosted by Fed Chair Jerome Powell's reiteration about recent spike in inflation as temporary on Tuesday, and the bipartisan agreement for Infrastructure deal reached on Thursday.  Energy stocks outperformed the market while real estate and utility stocks underperformed.  For the week, S&P 500 index went up 2.74% to 4280, Dow Jones Industrial Average gained 3.44%, and the technology laden NASDAQ composite index increased 2.35%. 

Both S&P 500 index and Nasdaq composite index moved higher and made record high this past week validating our view in the past few weeks. With both indices stay above their 28 week EMA with ascending momentum, we believe the indices will climb higher in the next few weeks. 


Weekly chart of S&P 500 index


Fund Rankings Update, 6/18/2021

 Weekly Average Momentum Index (AMI) rankings of HSA, SSPP, RSP, SELECT, ETF, iETF, sETF have been posted in "Rankings", "Trading Logs" pages, as well as in http://ycprankings.awardspace.us/RankingTables.htm. 


Trading signal occurs in HSA model portfolio: Sell NSVAX, Buy NBRIX
Trading signal occurs in SELECT model portfolio: Sell FSRBX, Buy FSESX
Trading signal occurs in ETF model portfolio: Sell IYT, Buy IYE


Major indices declined this week with DJIA suffered the most and NASDAQ composite index yield a small loss.  Federal reserve surprised the investor with a more hawkish stance in their post policy meeting Wednesday and Thursday announcement, as they see the inflation not as transitory as they originally thought and may raise interest rate sooner than anticipated. Tech and growth stocks outperformed the market with less decline wile cyclical and value stocks underperformed.  For the week, S&P 500 index went down 1.91% to 4166, Dow Jones Industrial Average lost 3.45%, and the technology laden NASDAQ composite index decreased 0.28%. 

S&P 500 index moved side way for another week hovering around 4200 while Nasdaq composite index tried to find its footing above 1400. The side way consolidation has improved the deviation of the S&P 500 index to its 28 week EMA from 10.8% in mid-April to 4.8% this past week. We expect the index will trending higher once the NASDAQ composite breaks its previous high of 14200 level next week. 

Two trading signals were issued in the HSA and SELECT model portfolios due to the recent sector rotation. In HSA model portfolio, a sell signal for NSVAX was issued and is replaced with NBRIX. The model portfolio has held NSVAX for 182 days with a gain of 19%. In the SELECT model portfolio, FSRBX will be replaced with FSESX.  As the momentum was not sustained, the FSRBX was  held only for 60 days with a loss of 4%.


Weekly chart of S&P 500 index


Weekly chart of NASDAQ composite index


Fund Rankings Update, 6/11/2021

 Weekly Average Momentum Index (AMI) rankings of HSA, SSPP, RSP, SELECT, ETF, iETF, sETF have been posted in "Rankings", "Trading Logs" pages, as well as in http://ycprankings.awardspace.us/RankingTables.htm. 


Trading signal occurs in sETF model portfolio: Sell IAT, Buy IEO


Tech stocks were pushed higher helped by the declining treasury bond yield through out the week as Fed indicated that they will continue the dovish monetary police for some time and the recent spike in inflation is temporary.  With the help from tech stocks, S&P 500 index reached all time high of 4249 on Thursday.   For the week, S&P 500 index went up 0.41% to 4247, Dow Jones Industrial Average lost 0.8%, and the technology laden NASDAQ composite index increased 1.85%. 

S&P 500 index moved side way with positive bias and reach the record high this past week as NASDAQ composite index broke above the 14000 psychological barrier. If Nasdaq composite index can solidify its footing above 14000 next week, we can see the uptrend that was paused since early April to resume.  An trading signal in sETF model portfolio was issued to sell IAT and buy the current number 1 AMI ranked IEO this week as the increasing energy prices pushed the related sectors higher. 


Weekly chart of S&P 500 index


Fund Rankings Update, 6/4/2021

Weekly Average Momentum Index (AMI) rankings of HSA, SSPP, RSP, SELECT, ETF, iETF, sETF have been posted in "Rankings", "Trading Logs" pages, as well as in http://ycprankings.awardspace.us/RankingTables.htm. 


Trading signal occurs in FEMKX timing system: Sell Cash, Buy FEMKX


Major indices ended the week a bit higher in this holiday shorten week.  Trading volume was still light with energy related stocks outperformed general markets.  US added 559K jobs in May less than expected but the unemployment rate ticked down from 6.1% to 5.8%. Bond rate fell back after the May job report indicating that investors expect Fed's monetary policy to remain accommodating.  For the week, S&P 500 index went up 0.61% to 4229, Dow Jones Industrial Average gained 0.66%, and the technology laden NASDAQ composite index increased 0.48%. 

S&P 500 index has gone side way for 7 weeks waiting for NASDAQ to break above the resistance at 1400. In the mean time, our FEMKX timing system, which has been a reliable indicator for market timing, has issued a buy signal as its momentum indicator STO[15,1] climbed above 50 shown in the weekly chart below. In the weekly chart, we can see FEMKX successfully tested its 28 week EMA in early May and broke above its resistance at 48 this week heading toward the previous high of $51.4. Readers can go to the trading log page to see the past performance of  FEMKX timing system, and we are looking forward to see how this buy signal perform in the future.


Weekly chart of S&P 500 index


Weekly chart of FEMKX

Fund Rankings Update, 5/28/2021

 Weekly Average Momentum Index (AMI) rankings of HSA, SSPP, RSP, SELECT, ETF, iETF, sETF have been posted in "Rankings", "Trading Logs" pages, as well as in http://ycprankings.awardspace.us/RankingTables.htm. 


Major indices ended the week broadly higher with growth stocks outperformed value stock.   For the week, S&P 500 index went up 1.16% to 4204, Dow Jones Industrial Average gained 0.94%, and the technology laden NASDAQ composite index increased 2.06%. 

S&P 500 index continued its side way consolidation while NASDAQ composite index continue its rebound after successfully tested the 28 week EMA as shown in the weekly charts below. Our technical outlook remains cautiously optimistic. As long as NASDAQ composite index does not fall below its 28 week EMA, we will see it slowly come back to resume its uptrend and carry S&P 500 index along with it. 


Weekly Chart of S&P 500 index


Weekly chart of NASDAQ composite index


Fund Rankings Update, 5/21/2021

Weekly Average Momentum Index (AMI) rankings of HSA, SSPP, RSP, SELECT, ETF, iETF, sETF have been posted in "Rankings", "Trading Logs" pages, as well as in http://ycprankings.awardspace.us/RankingTables.htm. 


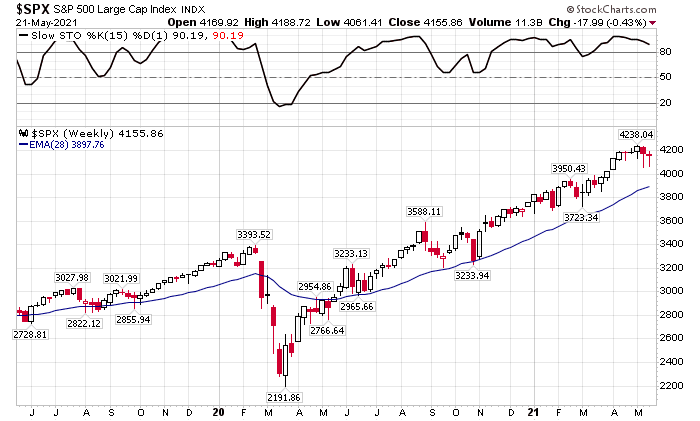
Major indices ended the week mixed with lingering worries about rising interests but supported by strength of economy rebound.  For the week, S&P 500 index went down 0.43% to 4155, Dow Jones Industrial Average lost 0.51%, while the technology laden NASDAQ composite index increased 0.31%. 

S&P 500 closed the week a bit lower than where it began for another week of side way consolidation as observed in the weekly chart below. For NASDAQ composite index, this is the second week it successfully tested the 28 week EMA as shown in its weekly chart. The 28 week EMA has been a very strong support for NASDAQ composite index in the past. The index has held at this EMA support in November 2020, March 2021 and now. If NASDAQ composite index does not fall below its 28 EMA, we will see it slowly come back and resume its uptrend that was disrupted since mid-February. The rise of Nasdaq composite will also carry S&P 500 index along with it in our opinion. Interestingly, our FEMKX timing system, which has been a reliable market timing indicator, has been out of market since March 8 and has stayed on the sideline since as shown in the trading log page. At this stage, we have to patiently wait for the market development and take action accordingly. 
 

Weekly Chart of S&P 500 index

Weekly chart of NASDAQ composite index


Fund Rankings Update, 5/14/2021

 Weekly Average Momentum Index (AMI) rankings of HSA, SSPP, RSP, SELECT, ETF, iETF, sETF have been posted in "Rankings", "Trading Logs" pages, as well as in http://ycprankings.awardspace.us/RankingTables.htm. 


Trading signal occurs in ETF model portfolio: Sell IJS, Buy IYT


Major indices especially the interest rate sensitive NASDAQ composite index plunged this past Wednesday after inflation data released by Labor Department showing Consumer prices jumped 0.9 % in April and consumer prices index rose 4.2%, much higher than the 3.6% expected by economists.  NASDAQ went down to 1300, 9% below its previous high and Dow Jones Industrial Average plunged more than 600 points on Wednesday.  Stocks recovered partially Thursday and Friday, helped by the consensus that the spike in inflation data likely to be temporary.  For the week, S&P 500 index went down 1.39% to 4173, Dow Jones Industrial Average lost 1.14%, while the technology laden NASDAQ composite index decreased 2.34%. 

S&P 500 index continued its side way consolidation around 4200, while NASDAQ composite index went down to test its 28 week moving average as shown in the weekly charts below.  With momentum indicator of the NASDAQ composite index falling below 80 and heading downward, tech stocks seem to have a few more weeks of consolidation to go, which will cause the S&P 500 index to continue its side way consolidation for another few weeks in our opinion. 

Due to momentum change, a trading signal is issued this week in ETF model portfolio to move out of IJS and buy into IYT.  The model portfolio has help IJS for 105 days with a gain of 22%.


Weekly chart of S&P 500 index

Weekly chart of NASDAQ composite index