Fund Rankings Update, 12/27/2024

The Weekly Average Momentum Index (AMI) rankings of HSA, SSPP, RSP, SELECT, ETF, iETF, and sETF have been posted on the "Rankings", and "Trading Logs" pages.


Stocks advanced moderately higher during this holiday-shortened week.   Major indices continued their rally into Monday and Tuesday but reversed the trend on Thursday and Friday after Christmas.  For the week, the S&P 500 went up 0.67%, closing at 5970, the Dow Jones Industrial Average rose 0.35%, and the technology-laden Nasdaq composite index increased 0.76%. 

The S&P 500 Index displayed reduced volatility this week, with price action confined within the previous week's trading range.  The 6100 level has acted as a short-term resistance from the weekly chart below.  A decisive break above 6100 will provide confirmation of the ongoing bullish trend.  The index continues to trade above its 28-week exponential moving average and remains within its established rising channel. With two trading days left for the year, it is interesting to see where it closes for the year.   


The weekly chart of the S&P 500 index


Fund Rankings Update, 12/20/2024

Weekly Average Momentum Index (AMI) rankings of HSA, SSPP, RSP, SELECT, ETF, iETF, and sETF have been posted on "Rankings", and "Trading Logs" pages.


Trading signal occurs in iETF model portfolio: Sell EZA, Buy EWS


Stocks declined broadly for the week with Dow Jones Industrial Average experiencing 10 days of consecutive loss, the longest losing streak since the 1970s.   All eyes were on the interest rate policy from Wednesday's Fed policy meeting.  The Fed did lower the interest rate by 0.25% as expected on Wednesday but projected to cut fewer times in 2025 according to the projection by its members.  Investors sentiment turned vastly negative as the Fed turned hawkish toward the path of future interest rates.  For the week, the S&P 500 went down 1.99%, closing at 5930, the Dow Jones Industrial Average fell 2.25%, and the technology-laden Nasdaq composite index fell 1.78%. 

With the decline this week, the S&P 500 index is still trading within its upward trading channel, currently sitting  4.1% above its 28-week exponential moving average.  Support levels are observed at 5650-5700 (short-term, aligned with the trendline) and 5200 (longer-term, relevant if the trend shifts bearish).  As the index continues to hold above its upward trendline, our bullish outlook for the market remains unchanged. 


The weekly chart of the S&P 500 index


Fund Rankings Update, 12/13/2024

Weekly Average Momentum Index (AMI) rankings of HSA, SSPP, RSP, SELECT, ETF, iETF, and sETF have been posted on "Rankings", and "Trading Logs" pages.


Trading signal occurs in SSPP model portfolio: Sell FIUIX, Buy FDEGX


Stocks closed the week mixed with the technology-laden NASDAQ composite indexes breaking the 20000 barrier for the first time.  Investors were largely waiting for the Fed's interest decision next week. The CPI and PPI data released Wednesday and Thursday mostly met expectations with a slight uptick in monthly PPI.   On Thursday, the Labor Department reported a surprise jump in weekly initial jobless claims of 242,000 suggesting a softening labor market.   With slowing inflation and a cooling labor market, expectations for a rate cut by the Fed next week have increased.  For the week, the S&P 500 went down 0.64%, closing at 6051, the Dow Jones Industrial Average fell 1.82%, while the technology-laden Nasdaq composite index rose 0.34%. 

The S&P 500 index continued its upward march along the upper boundary of its trading channel. Given the index's position above its 28-week exponential moving average and its strong momentum, our bullish outlook remains unchanged.


The weekly chart of the S&P 500 index


Fund Rankings Update, 12/6/2024

Weekly Average Momentum Index (AMI) rankings of HSA, SSPP, RSP, SELECT, ETF, iETF, and sETF have been posted on "Rankings", and "Trading Logs" pages.


Trading signal occurs in SELECT model portfolio: Sell FSTCX, Buy FSLBX


Stocks closed the week mixed with the S&P 500 and NASDAQ composite indexes reaching record highs while the Dow Jones Industrial Average suffered a loss.  Growth stocks outperformed value stocks and Large caps outperformed small caps.  Several key labor market indicators were released during the week. On Tuesday, the Labor Department reported that U.S. job openings increased in October by 7.74 million, up from September's 7.37 million. On Wednesday,  ADP reported that US private companies added 148000 jobs and a 4.8% annual pay increase.  Finally, on Friday, the Labor Department reported that the U.S. added 227,000 jobs in November, slightly higher than the expectation but a sharp increase from October. Wall Street viewed these data as a positive factor for the Fed to cut interest rates by another 0.25% in the next Fed policy meeting on December 17. For the week, the S&P 500 went up 0.96%, closing at 6090, the Dow Jones Industrial Average fell 0.6%, while the technology-laden Nasdaq composite index jumped 3.34%. 

The technical picture and outlook for The S&P 500 index stay the same as last week.    With the index's high momentum, it is expected to continue its ascent along the upper boundary of its trading channel.

Note: Numerous funds are scheduled to distribute year-end capital gains and dividends over the next few weeks.  As this information isn't automatically accessible, I will need to manually adjust momentum indicator calculations. Consequently, momentum rankings may be less accurate than usual during this time, a pattern observed in past years." 


The weekly chart of the S&P 500 index


Fund Rankings Update, 11/29/2024

Weekly Average Momentum Index (AMI) rankings of HSA, SSPP, RSP, SELECT, ETF, iETF, and sETF have been posted on "Rankings", and "Trading Logs" pages.


Trading signal occurs in ETF model portfolio: Sell FXI, Buy IGV


Stocks closed higher for the second week with the S&P 500 index and the Dow Jones Industrial Average reaching record highs.  Market sentiment was mostly influenced by the incoming President Trump's appointment of Scott Bessent as Treasury secretary and his plan to impose 25% tariffs on goods from Canada and Mexico along with an additional 10% tariff on imports from China. The economic data released during the week generally met expectations with personal income and personal spending exceeding expectations while durable goods fell short. For the week, the S&P 500 went up 1.06%, closing at 6032, the Dow Jones Industrial Average advanced 1.39%, and the technology-laden Nasdaq composite index increased 1.23%. 

The S&P 500 index continued its ascent along the upper boundary of its trading channel as shown in the weekly chart below.  Given the index's high momentum, we maintain our positive outlook for the remainder of the year.  


The weekly chart of the S&P 500 index


Fund Rankings Update, 11/22/2024

Weekly Average Momentum Index (AMI) rankings of HSA, SSPP, RSP, SELECT, ETF, iETF, and sETF have been posted on "Rankings", and "Trading Logs" pages.


Stocks closed higher broadly recovering some of the loss from the previous week with the small-cap stocks outperforming the large-cap stocks.  Much of the focus was on NVIDIA's third-quarter earnings announcement on Wednesday after the market close.  The company reported revenue and earnings exceeded analyst's expectations but with light guidance for the fourth quarter revenue.  Investors were generally satisfied with the results and the stocks ended up flat for the week.  On the economic front, investors were encouraged by the unexpected drop in weekly initial jobless claims and the surprising rise in existing home sales in October.  For the week, the S&P 500 went up 1.68%, closing at 5969, the Dow Jones Industrial Average advanced 1.96%, and the technology-laden Nasdaq composite index increased 1.73%. 


The S&P 500 index rebounded from last week's losses and swiftly went back to the top of its trading range. The index's successful test of the crucial 5870 support level, which aligns with its prior high and the 20-day Exponential Moving Average (EMA), validates our positive outlook from last week.  With the bulls gaining momentum, we expect the index to continue its upward charge.


The weekly chart of the S&P 500 index


Fund Rankings Update, 11/15/2024

Weekly Average Momentum Index (AMI) rankings of HSA, SSPP, RSP, SELECT, ETF, iETF, and sETF have been posted on "Rankings", and "Trading Logs" pages, as well as in http://ycprankings.awardspace.us/RankingTables.htm.


Trading signal occurs in HSA model portfolio: Sell CSFZX, Buy CSMUX


Stocks closed lower as the post-election rally failed to maintain its momentum.  As President-elect Donald Trump continued to announce his new cabinet members during the week, uncertainty about the incoming administration's policies started to weigh on investors' sentiment.  On the economic front, the CPI and PPI inflation data released on Wednesday and Thursday were largely in line with the expectation.  However, Fed Chair Powell made the comment on Thursday that the Fed is in no hurries to lower the interest rates, which dampened the market sentiment as well.    For the week, the S&P 500 gave up 2.08%, closing at 5870, the Dow Jones Industrial Average fell 1.24%, and the technology-laden Nasdaq composite index decreased 3.15%. 


The S&P 500 has erased its post-election gains this week. The index is now testing its first support level around 5870, which coincides with its previous high and the 20-day EMA.  A successful defense of this level could propel the index to a new high of 6200. However, a breakdown below 5870 might trigger a decline to the next support at 5700.  Despite recent weakness, the overall technical outlook remains bullish. We anticipate continued upward momentum until the index breaks below the 28-week EMA.


Weekly chart of the S&P 500 index


Fund Rankings Update, 11/8/2024

Weekly Average Momentum Index (AMI) rankings of HSA, SSPP, RSP, SELECT, ETF, iETF, and sETF have been posted on "Rankings", and "Trading Logs" pages, as well as in http://ycprankings.awardspace.us/RankingTables.htm.


Stocks closed broadly higher this week as Trump won his second term of the U.S. presidency followed by a  0.25% interest rate cut from the Fed. With the Republicans also winning control of both the Senate and the House, investors anticipate business-friendlier policies from the next administration, which will result in looser regulations, lower taxes, and faster company earning growth.  For the week, the S&P 500 jumped 4.66% to another record high, closing at 5995, the Dow Jones Industrial Average advanced 4.61%, and the technology-laden Nasdaq composite index increased 5.74%. 


After two weeks of modest decline, the S&P 500 surged 4.66% to a new all-time high.  Instead of dipping to the 5600-5650 support zone, the index found a solid floor at the 5700 level. This reversal, coupled with a positive shift in momentum indicators, suggests that the upward trend remains intact. We anticipate the index to continue its ascent along the upper edge of its rising trading channel.  


The weekly chart of the S&P 500 index


Fund Rankings Update, 11/1/2024

Weekly Average Momentum Index (AMI) rankings of HSA, SSPP, RSP, SELECT, ETF, iETF, and sETF have been posted on "Rankings", and "Trading Logs" pages, as well as in http://ycprankings.awardspace.us/RankingTables.htm.


Trading signal occurs in SSPP model portfolio: Sell FRESX, Buy FIUIX.

Trading signal occurs in FEMKX timing system: Sell FEMKX, Buy Cash

Trading signal occurs in sETF model portfolio: Sell ITB, Buy IYZ


Stocks closed lower for the second week after major tech companies reported quarterly earnings. Despite strong earnings from tech giants like Apple, Google, Amazon, Microsoft, and Meta, investors remained unimpressed.  On the economic data front, the Labor Department reported on Friday that the U.S. added only 12000 jobs in October, the lowest since December 2020.  Economists attributed the low employment data to the damages caused by Hurricanes Helene, Milton, and the Boeing strike.  For the week, the S&P 500 lost 1.37%, closing at 5728, the Dow Jones Industrial Average dipped 0.15%, and the technology-laden Nasdaq composite index decreased 1.5%. 

The S&P 500 has undergone a modest pullback over the last two weeks, consistent with our expectations. The index is still trading above its 28-week EMA exhibiting robust momentum. We anticipate that the index will find support at the 5600-5650 level and resume its upward trajectory. 


The weekly chart of the S&P 500 index


Fund Rankings Update, 10/25/2024

Weekly Average Momentum Index (AMI) rankings of HSA, SSPP, RSP, SELECT, ETF, iETF, and sETF have been posted on "Rankings", and "Trading Logs" pages, as well as in http://ycprankings.awardspace.us/RankingTables.htm.


Stocks took a pause after six weeks of consecutive gains with Large-cap stocks and growth stocks outperforming the small-caps and value stocks.  Rising long-term treasury yields were the culprit as investors shifted to a shallower rate-cutting expectation due to stronger-than-expected economic growth and a slower decline in inflation. The S&P 500 lost 0.96% for the week, closing at 5808, the Dow Jones Industrial Average dropped 2.68%, while the technology-laden Nasdaq composite index increased 0.16%. 

The S&P 500 index has shown continued strength, trading near the upper boundary of its recent range. While we anticipate periods of sideways movement or minor corrections, the index's position above its 28-week exponential moving average and its strong momentum signal a positive outlook for the near future.


The weekly chart of the S&P 500 index


Fund Rankings Update, 10/18/2024

Weekly Average Momentum Index (AMI) rankings of HSA, SSPP, RSP, SELECT, ETF, iETF, and sETF have been posted on "Rankings", and "Trading Logs" pages, as well as in http://ycprankings.awardspace.us/RankingTables.htm.


Trading signal occurs in ETF model portfolio: Sell IYR, Buy FXI.


Stocks advanced higher with the S&P 500 index reaching another record level. The advancements were led by the utility and real estate sectors with small-cap and mid-cap stocks outperforming the general market.  Despite a lighter week of economic news, positive signs emerged. The September retail sales, released on Wednesday, went up 0.4% much higher than the 0.1% registered in August, and the weekly initial jobless claims fell unexpectedly to 241,000.  For the week, The S&P 500 gained 0.85%, closing at 5864, the Dow Jones Industrial Average advanced 0.96%, and the Nasdaq composite index increased 0.8%. 

The S&P 500 index continued its upward trajectory, reaching a new all-time high near the upper boundary of its trading channel. Given the index's strong momentum, we anticipate the bullish trend to persist. However, it's important to note that short-term pullbacks or periods of sideways consolidation are likely to occur.


The weekly chart of the S&P 500 index


Fund Rankings Update, 10/11/2024

Weekly Average Momentum Index (AMI) rankings of HSA, SSPP, RSP, SELECT, ETF, iETF, and sETF have been posted on "Rankings", and "Trading Logs" pages, as well as in http://ycprankings.awardspace.us/RankingTables.htm.


Trading signal occurs in HSA model portfolio: Sell DZCRX, Buy CSFZX.


Stocks climbed to new heights, with both the S&P 500 and Dow Jones Industrial Average reaching record levels. The positive earnings reports from JPMorgan Chase and Wells Fargo marked the beginning of the third-quarter earnings season. However, inflation proved to be persistent, as the September core CPI increased by 0.3% month-over-month, exceeding expectations of 0.2%. Additionally, the September core PPI rose 0.2% as anticipated. This unexpected rise in inflation dashed investors' hopes for a more aggressive 0.5% interest rate cut by the Federal Reserve in November. Instead, the market is now leaning towards a more moderate 0.25% rate reduction.  For the week, The S&P 500 gained 1.11%, closing at 5815, the Dow Jones Industrial Average advanced 1.21%, and the Nasdaq composite index increased 1.13%. 

The S&P 500 advanced to another record high, fueled by strong momentum. The index has maintained an upward trend for five consecutive weeks. While a minor pullback or sideways consolidation might be expected, our overall positive outlook for the S&P 500 remains unchanged. 


The weekly chart of the S&P 500 index


Fund Rankings Update, 10/4/2024

Weekly Average Momentum Index (AMI) rankings of HSA, SSPP, RSP, SELECT, ETF, iETF, and sETF have been posted on "Rankings", and "Trading Logs" pages, as well as in http://ycprankings.awardspace.us/RankingTables.htm.


Trading signal occurs in SELECT model portfolio: Sell FBIOX, Buy FSTCX.


Stocks closed the week with modest gain and continued its winning streak for the fourth week. Tension in the Middle East sent the oil prices higher and the dockworkers' strike at the Eastern seaport also weighed on investors sentiment.  However, investors found positive support Friday as the Labor Department released that the US added 254,000 nonfarm payrolls in September nearly double the expectation, which indicated that the FED may have successfully engineered a soft landing scenario.  For the week, The S&P 500 gained 0.22%, closing at 5751, the Dow Jones Industrial Average advanced 0.09%, and the Nasdaq composite index increased 0.1%. 

The S&P 500 index has sustained a steady upward trend. As illustrated in the daily chart, the index successfully retested its 20-day Exponential Moving Average (EMA) on both Wednesday and Thursday. This pattern presents attractive buying opportunities for investors seeking short-term gains from the ongoing market rally, as previously discussed in our blogs.


The weekly chart of the S&P 500 index


The daily chart of the S&P 500 index


Fund Rankings Update, 9/27/2024

Weekly Average Momentum Index (AMI) rankings of HSA, SSPP, RSP, SELECT, ETF, iETF, and sETF have been posted on "Rankings", and "Trading Logs" pages, as well as in http://ycprankings.awardspace.us/RankingTables.htm.


Trading signal occurs in sETF model portfolio: Sell IAT, Buy ITB.

Trading signal occurs in FEMKX timing system: Sell Cash, Buy FEMKX.


The stock market continued its upward trend this week, with the S&P 500 index and Dow Jones Industrial Average reaching new record highs.  The economic news released during the week showed both softness in economic growth and the tameness in inflation. The U.S. consumer confidence index fell sharply to 98.7 in August, the lowest level in two years, and new home sales declined 4.7% in August, although not as much as expected.  On Friday, the Commerce Department reported that the core personal consumer expenditures (PCE) price index, rose only 0.1% in August. The index climbed only 2.2% yearly, close to the Fed’s 2.0% long-term inflation target.  For the week, The S&P 500 gained 0.62%, closing at 5738, the Dow Jones Industrial Average advanced 0.59%, and the Nasdaq composite index increased 0.95%. 

The S&P 500 index has maintained its strong upward trajectory. Our bullish stance remains unchanged: We anticipate further gains, and any pullback to the 10-day or 20-day moving averages on the daily chart should be considered potential buying opportunities. 


The weekly chart of the S&P 500 index


Fund Rankings Update, 9/20/2024

Weekly Average Momentum Index (AMI) rankings of HSA, SSPP, RSP, SELECT, ETF, iETF, and sETF have been posted on "Rankings", and "Trading Logs" pages, as well as in http://ycprankings.awardspace.us/RankingTables.htm.


Stocks marched higher with S&P 500 index and Dow Jones Industrial Average reaching all-time highs after the Fed cut the interest rate by 0.5% on Wednesday.  In addition to the Fed's rate cut which signaled the start of the rate-cutting cycle, the positive economic news released during the week also boosted investors' sentiment.  The retail sales in July went up 0.1%, significantly more than the -0.2% expected, and the weekly unemployment claims went down to 219K from 231K in the previous week. For the week, The S&P 500 went up 1.36%, closing at 5702, the Dow Jones Industrial Average advanced 1.62%, and the Nasdaq composite index increased 1.49%. 

The S&P 500 index has closed above its previous high of 5669 and the psychological resistance of 5700.   Given its strong upward momentum, the index is likely to continue trending higher.  As previously noted,  any dips to the 10-day or 20-day EMAs on the daily chart can be seen as buying opportunities.  


The weekly chart of the S&P 500 index


Fund Rankings Update, 9/13/2024

Weekly Average Momentum Index (AMI) rankings of HSA, SSPP, RSP, SELECT, ETF, iETF, and sETF have been posted on "Rankings", and "Trading Logs" pages, as well as in http://ycprankings.awardspace.us/RankingTables.htm.


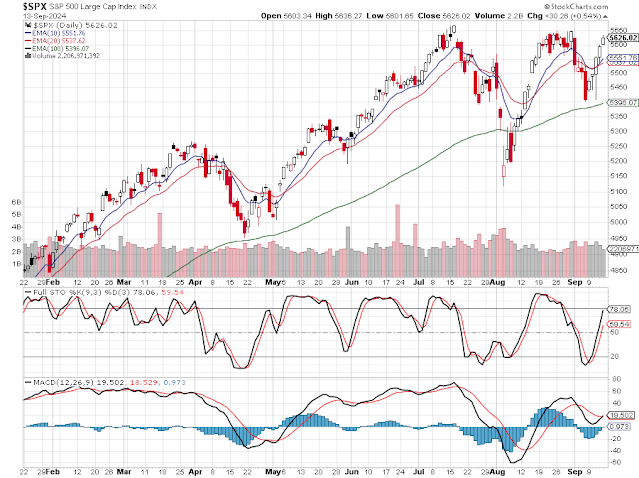
Stocks closed sharply higher recovering the loss from the previous week with help from technology sectors.  Core inflation in August released on Wednesday went up 0.3%, a tick higher than expected, while the headline inflation peaked at 2.5%, well below the 2.9% in July.  For the week, The S&P 500 went up 4.02%, closing at 5626, the Dow Jones Industrial Average advanced 2.6%, and the Nasdaq composite index jumped 5.95%. 

The S&P 500 index has successfully tested the 100-day EMA support and closed above its 10-day and 20-day EMAs on the daily chart.  While the index did not fully test its 28-week EMA support at 5300 on the weekly chart, the price action suggests that it has completed the "W" shape recovery pattern and will likely continue its upward trend. Any dips to the 10-day or 20-day EMAs can be seen as buying opportunities.  


The weekly chart of the S&P 500 index


The daily chart of the S&P 500 index


Fund Rankings Update, 9/6/2024

Weekly Average Momentum Index (AMI) rankings of HSA, SSPP, RSP, SELECT, ETF, iETF, and sETF have been posted on "Rankings", and "Trading Logs" pages, as well as in http://ycprankings.awardspace.us/RankingTables.htm.


Stocks closed sharply lower this week as worries about recession weighed on investors' sentiment. Data released during the week all painted a slowdown in economic growth.  The ISM manufacturing PMI released on Tuesday remained firmly in contraction territory in August, and the July job openings reported by the Labor Department on Wednesday fell to 7.67 million, the lowest level since 2021.  On Friday, the Labor Department reported that the US added only 142K jobs well below the 164K jobs estimation.  For the week, The S&P 500 went down 4.25%, closing at 5408, the Dow Jones Industrial Average fell 2.93%, and the Nasdaq composite index plunged 5.77%. 

The S&P 500 index failed to close above its previous high of 5670 and plunged significantly to 5408, near its 28-week exponential moving average of 5309.  This development has invalidated our anticipated "V"-shape recovery. Instead, a "W"-shape recovery becomes more probable if the index can find support around 5300 and successfully tested that level.  However, the recent price action has formed a double top bearish formation with the neck line support at 5100.  If that support was broken, we will see a major down turn which may take the index down to previous high of 4600.  Despite this bearish scenario, the expected interest rate cut by the Federal Reserve in its upcoming meeting on September 17-18 suggests that a "W"-shaped recovery remains a more likely outcome. 


The weekly chart of the S&P 500 index


Fund Rankings Update, 8/30/2024

Weekly Average Momentum Index (AMI) rankings of HSA, SSPP, RSP, SELECT, ETF, iETF, and sETF have been posted on "Rankings", and "Trading Logs" pages, as well as in http://ycprankings.awardspace.us/RankingTables.htm.


Trading signal occurs in iETF model portfolio: Sell EWT, Buy EZA


Stocks closed mixed this week with the tech stocks dragged down by NVIDIA after its widely anticipated earning report.  On the economic front, the core personal consumption expenditures (PCE) price index released on Friday morning showed prices rising only 0.2% in July and 2.6% year over year.  Investors welcomed the data, which confirmed that inflation is easing and increased their confidence that the Federal Reserve will lower interest rates in September.  For the week, The S&P 500 went up 0.24%, closing at 5648, the Dow Jones Industrial Average advanced 0.94%, and the Nasdaq composite index decreased 0.92%. 

The S&P 500 index has approached its previous high of 5670.  If the index closes above 5670 next week, a bullish "V" shape formation will be completed in the weekly chart and the index will continue its intermediate upward trend.  As discussed before, a potential entry point will be after the index surpasses the previous high and then retraces back to retest the support at 5670.


The weekly chart of the S&P 500 index


Fund Rankings Update, 8/23/2024

Weekly Average Momentum Index (AMI) rankings of HSA, SSPP, RSP, SELECT, ETF, iETF, and sETF have been posted on "Rankings", and "Trading Logs" pages, as well as in http://ycprankings.awardspace.us/RankingTables.htm.


Trading signal occurs in sETF model portfolio: Sell IYW, Buy IAT


Stocks advanced modestly higher this week with the Fed chair Jerome Powell hinting at a rate cut in September in his speech at the annual economic symposium in Jackson Hole, Wyoming. The economic data released over the week such as Flash manufacturing PMI, Flash service PMI, and existing home sales, all aligned with expectations. However, the non-farm payroll count was revised downward by a significant 818,000, far exceeding forecasts.  For the week, The S&P 500 went up 1.45%, closing at 5634, the Dow Jones Industrial Average advanced 1.27%, and the Nasdaq composite index increased 1.4%. 

As the S&P 500 index continues its rally,  a bullish "V" shape formation will be completed if the index closes above the previous high of 5670.  However, if the index fails to close above its previous high and falls right back, a bearish double-top pattern will be formed which will cause the index to fall back to the trend line support at 5300.  For the first scenario, a potential entry point might be after the index surpasses the previous high and then retraces slightly to retest the support. In the second scenario, waiting for a rebound from the trendline support could mark the completion of the W-shaped recovery and offer an entry opportunity.


The weekly chart of the S&P 500 index


Fund Rankings Update, 8/16/2024

 Weekly Average Momentum Index (AMI) rankings of HSA, SSPP, RSP, SELECT, ETF, iETF, and sETF have been posted on "Rankings", and "Trading Logs" pages, as well as in http://ycprankings.awardspace.us/RankingTables.htm.


Stocks advanced broadly higher this week, encouraged by the tamed inflation data and positive economic news. The July core PPI reported on Tuesday by the Labor Department was flat month over month ending three months of increase, and the year-over-year CPI, reported Wednesday, fell to 2.9% for the first time in three years.  On Thursday,  the Commerce Department reported that retail sales jumped 1.0% in July well above the expected 0.4%, bolstering investors' "soft landing" scenario.    For the week, the S&P 500 went up 3.93%, closing at 5554. The Dow Jones Industrial Average advanced 2.94%, and the Nasdaq composite index jumped 5.29%. 


The S&P 500 has rebounded sharply over the past two weeks, surpassing its 28-week exponential moving average. A continued upward trajectory without a pullback to close above its previous peak of 5670 would confirm a V-shaped recovery. In this scenario, a potential buying opportunity could arise after a retest of the 5670 level. However, if the index retraces back to its 20-day EMA (currently at 5400) or 100-day EMA (currently at 5320) on the daily chart, it would form a W-bottom pattern, presenting another buying opportunity. The market's behavior over the next two weeks will determine whether the recovery follows a V-shaped or W-shaped path.


The weekly chart of the S&P 500 index


The daily chart of the S&P 500 index


Fund Rankings Update, 8/9/2024

Weekly Average Momentum Index (AMI) rankings of HSA, SSPP, RSP, SELECT, ETF, iETF, and sETF have been posted on "Rankings", and "Trading Logs" pages, as well as in http://ycprankings.awardspace.us/RankingTables.htm.


Major indices closed modestly lower as investors continue to worry about economic growth. Stocks opened sharply lower on Monday but quickly found their way back as the week progressed. Positive economic news including the better-than-expected ISM Services PMI released Monday and the unexpected drop in weekly jobless claims on Thursday have eased the investors' recession fear.   For the week, the S&P 500 went down 0.04%, closing at 5344. The Dow Jones Industrial Average fell 0.6%, and the Nasdaq composite index decreased 0.18%. 


The S&P 500 opened the week sharply below its 28-week exponential moving average but quickly recovered and closed 2.2% above the trend line on the weekly chart.  On the daily time frame, the index has fallen below its 100-day exponential moving average but managed to close above its 10-day exponential moving average. It appears that the index has completed its first leg of the "W" bottom formation.  If the S&P 500 continues to rise above its 20-day exponential moving average and subsequently retraces to form the second leg of the "W" pattern within the next few weeks, it could mirror the corrective behavior seen in April and May, presenting a potential buying opportunity.   


The weekly chart of the S&P 500 index


The daily chart of the S&P 500 index


Fund Rankings Update, 8/2/2024

Weekly Average Momentum Index (AMI) rankings of HSA, SSPP, RSP, SELECT, ETF, iETF, and sETF have been posted on "Rankings", and "Trading Logs" pages, as well as in http://ycprankings.awardspace.us/RankingTables.htm.


Trading signal occurs in RSP model portfolio: Sell FCNTX, Buy ARGFX

Trading signal occurs in SSPP model portfolio: Sell FBGRX, Buy FRESX

Trading signal occurs in HSA model portfolio: Sell MLAIX, Buy DCZRX

Trading signal occurs in SELECT model portfolio: Sell FSELX, Buy FBIOX

Trading signal occurs in ETF model portfolio: Sell IYW, Buy IYR


Major indices closed sharply lower as investors grappled with disappointing economic indicators and mixed earnings from tech giants. Worries about the strength of the economic growth weighed heavily on investors' sentiment. The release of the Institute for Supply Management’s (ISM’s)  July manufacturing activity on Thursday fell unexpectedly to 46.6 (Readings below 50.0 indicate contraction.)  and the Labor Department reported that the U.S. added only 114,000 jobs in July, well below the expected 176, 000 jobs, while the unemployment rate rose unexpectedly to 4.3% from 4.1%.   For the week, the S&P 500 went down 2.06%, closing at 5346. The Dow Jones Industrial Average lost 2.1%, and the Nasdaq composite index plunged another 3.35%. 


The S&P 500 has experienced a sharp three-week decline and currently sits 2.4% above its 28-week exponential moving average (EMA) of 5219.  A short-term rebound is possible next week as the index approaches the critical support level of 5260.  However, negative momentum and the need for bottom formation suggest the pullback may extend for another few weeks.  


The weekly chart of the S&P 500 index


Fund Rankings Update, 7/26/2024

Weekly Average Momentum Index (AMI) rankings of HSA, SSPP, RSP, SELECT, ETF, iETF, and sETF have been posted on "Rankings", and "Trading Logs" pages, as well as in http://ycprankings.awardspace.us/RankingTables.htm.


Trading signal occurs in iETF model portfolio: Sell EWN, Buy EWT


Investors continued to take monies out of tech stocks and rotate them into value and small-cap stocks for the second week.  Core (less food and energy) personal consumption expenditures (PCE) price index released by the Commerce Department rose 0.2% in June and 2.6% year over year, which enforced economists' expectation for a rate cut in September from the FED.  Other economic data released during the week showed a mixed picture of the economic growth: Home sales were down more than expected as well as S&P's Manufacturing Purchasing Managers' Index (flash PMI).  However, the Commerce Department reported that durable goods orders went up in June and consumer spending rose at an annualized pace of 2.3% in the second quarter, more than expected.   For the week, the S&P 500 went down 0.83%, closing at 5459. The Dow Jones Industrial Average gained 0.75%, and the Nasdaq composite index plunged 2.08%.

The S&P 500 index bounced to 5459 this week after testing the psychological support at 5400. Despite the rebound, weakening momentum suggests the index is heading towards another hurdle: the 28-week exponential moving average around 5460, which also coincides with its previous peak.   As we discussed last week, the market’s behavior at this key level could present a potential buying opportunity for the second half of the year. 


The weekly chart of the S&P 500 index

Fund Rankings Update, 7/19/2024

Weekly Average Momentum Index (AMI) rankings of HSA, SSPP, RSP, SELECT, ETF, iETF, and sETF have been posted on "Rankings", and "Trading Logs" pages, as well as in http://ycprankings.awardspace.us/RankingTables.htm.


Trading signal occurs in sETF model portfolio: Sell IDU, Buy IYW

Trading signal occurs in FEMKX timing system: Sell FEMKX, Buy Cash


Investors dumped tech stocks in favor of value and small-cap stocks, leading to a major shift in stock market sectors. Previously hot chip stocks like NVIDIA and Taiwan Semiconductor Manufacturing fell the most.  Economic data showed mixed signals: June retail sales were surprisingly strong, while jobless claims increased. Federal Reserve Chair Jerome Powell expressed concern that keeping interest rates too high for too long could hurt the economy. Economists now fully expect a rate cut in September.  For the week, the S&P 500 went down 0.71%, closing at 5505. The Dow Jones Industrial Average gained 0.72%, and the Nasdaq composite index plunged 3.65%.

The stock market hit a rough patch after reaching a high near our target of 5700. The S&P 500 fell to 5505 after three days of heavy selling in technology stocks. The index is still trading above its 28-week exponential moving average, but some technical indicators (bearish engulfing candle stick pattern and falling momentum) suggest a potential pullback. If the price falls further, a key support level to watch is around 5265 which corresponds to the previous high and the 28-week EMA. This could be a good opportunity to buy, similar to what happened in April. But we will make our determination when we get there. 


The weekly chart of the S&P 500 index


Fund Rankings Update, 7/12/2024

 Weekly Average Momentum Index (AMI) rankings of HSA, SSPP, RSP, SELECT, ETF, iETF, and sETF have been posted on "Rankings", and "Trading Logs" pages, as well as in http://ycprankings.awardspace.us/RankingTables.htm.


Stocks continued their rallies broadly this week with small-caps companies leading the way. Investors' sentiments were supported by the positive inflation data.  Consumer Price Index released on Thursday by the Labor Department went down 0.1% in June making it the first decline since May 2020.  For the week, the S&P 500 climbed 0.87%, closing at 5615. The Dow Jones Industrial Average gained 1.59%, and the Nasdaq composite index went up 0.25%.

The S&P 500 index is currently 8.6% above its 28-week exponential moving average and continues to march higher.  The index is at an all-time high and any bad news can trigger large swings. Our next target level for the index is 5700, but caution is needed as market corrections can occur without warnings. 


The weekly chart of the S&P 500 index


Fund Rankings Update, 7/5/2024

Weekly Average Momentum Index (AMI) rankings of HSA, SSPP, RSP, SELECT, ETF, iETF, and sETF have been posted on "Rankings", and "Trading Logs" pages, as well as in http://ycprankings.awardspace.us/RankingTables.htm.


The stock market kicked off the second half of the year on a positive note, reaching another record high. This rally was fueled by investor anticipation of an interest rate cut from the Federal Reserve in September. Weaker-than-expected economic data, including manufacturing and service PMI readings on Monday and Wednesday, as well as the soft June jobs report released Friday, pointed to a slowing economy. The S&P 500 climbed 1.95% for the week, closing at 5567. The Dow Jones Industrial Average gained 0.66%, and the Nasdaq composite index surged 3.54%.

The S&P 500 has continued its strong performance, reaching new record highs. This momentum could propel the index toward our next target level of 5700 with ease, but caution is still warranted as market corrections can occur even during bullish trends. 


The weekly chart of the S&P 500 index


Fund Rankings Update, 6/28/2024

 Weekly Average Momentum Index (AMI) rankings of HSA, SSPP, RSP, SELECT, ETF, iETF, and sETF have been posted on "Rankings", and "Trading Logs" pages, as well as in http://ycprankings.awardspace.us/RankingTables.htm.


Trading signal occurs in ETF model portfolio: Sell FXI, Buy IYW


Stock markets remained mostly unchanged this week as investors adjusted their portfolios at the end of the first half of the year. On the economic data front, the Bureau of Economic Analysis released the core personal consumption expenditures (PCE) price index on Friday, which showed that prices excluding food and energy rose 0.1% month over month in May. Core PCE is the Fed’s preferred measure of inflation.  This positive data increased investor confidence that the Federal Reserve will cut interest rates in September.  For the week, the S&P 500 lost 0.08% to close at 5460, the Dow Jones Industrial Average decreased 0.08%, while the Nasdaq composite index went up 0.24%.

The S&P 500 index briefly surpassed our target of 5500 on Friday but fell back before closing. Despite this, our forecast for the index remains unchanged from last week. We believe a period of sideways movement or a minor pullback could actually solidify the foundation for the rally to continue in the latter half of the year


The weekly chart of the S&P 500 index


Fund Rankings Update, 6/21/2024

Weekly Average Momentum Index (AMI) rankings of HSA, SSPP, RSP, SELECT, ETF, iETF, and sETF have been posted on "Rankings", and "Trading Logs" pages, as well as in http://ycprankings.awardspace.us/RankingTables.htm.


Stock markets hit new highs again this week, with value stocks leading the charge over the growth and tech stocks. Despite weaker consumer spending data, with May retail sales missing expectations, a positive surprise came from the manufacturing sector. The PMI unexpectedly rose to 51.7, indicating continued strength in manufacturing.  For the week, the S&P 500 gained 0.61% to close at 5464, the Dow Jones Industrial Average increased 1.45%, and the Nasdaq composite index remained flat.

The S&P 500 index dipped after briefly surpassing our target of 5500 on Thursday, closing lower for two straight days. Despite this short pullback, the index remains in a strong uptrend following a robust 9-week rally. It sits comfortably above its 28-week exponential moving average with strong upward momentum. We anticipate the index to maintain its overall upward trajectory, with potential periods of sideways consolidation.


The weekly chart of the S&P 500 index


Fund Rankings Update, 6/14/2024

Weekly Average Momentum Index (AMI) rankings of HSA, SSPP, RSP, SELECT, ETF, iETF, and sETF have been posted on "Rankings", and "Trading Logs" pages, as well as in http://ycprankings.awardspace.us/RankingTables.htm.


Trading signal occurs in HSA model portfolio: Sell CSMUX, Buy MLAIX


US major indices closed mixed with technology and growth stocks outperforming the general markets. Enthusiasm about Artificial Intelligence continued to propped up tech sectors and the favorable inflation data released during the week boosted growth stocks.   On Wednesday, the Labor Department reported that the May CPI (Consumer Price Index) was flat month over month and the core CPI was 0.2% month over month, 0.1% below expectation.  On an annual basis, the CPI was 3.3 % year over year which was also 0.1% below expectation.  In addition, data released on Thursday by the Labor Department showed that the May core Produce Price Index (PPI) was flat month over month, significantly below the expected 0.3% and the PPI was -0.2%, way below the expected +0.1%.  Although these data were released after the Fed's decision to hold the interest rate steady for now and may have only one cut this year, investors hoped the progress in inflation could soften the Fed's future decision.   For the week, the S&P 500 advanced 1.58% to 5431, the Dow Jones Industrial Average decreased 0.54%, and the Nasdaq composite index shot up 3.24%.

The S&P 500 continued its strong run this week, climbing 1.58%. The index remains well above its 28-week exponential moving average, indicating that its upward momentum is strengthening. We are optimistic that the index will hit its next target of 5500 soon.


The weekly chart of the S&P 500 index


Fund Rankings Update, 6/7/2024

Weekly Average Momentum Index (AMI) rankings of HSA, SSPP, RSP, SELECT, ETF, iETF, and sETF have been posted on "Rankings", and "Trading Logs" pages, as well as in http://ycprankings.awardspace.us/RankingTables.htm.


US major indices closed higher with growth stocks outperforming the value stocks. Data released during the week painted a mixed picture of the US economy.  The Institute for Supply Management (ISM) which gauges manufacturing activity fell to 48.7 below the 50.0 growth threshold, while the Labor Department reported US added 272000 jobs in May, well above the expected 182000 jobs. Analysts think that the FED will continue to keep the interest rate steady for the summer under the cooling manufacturing activities and hot labor market economic conditions.  For the week, the S&P 500 advanced 1.32% to 5346, the Dow Jones Industrial Average increased 0.29%, and the Nasdaq composite index shot up 2.38%.

A divergence between the S&P 500 index and its momentum indicator has started to develop in the weekly chart. The index has made another all-time high while its momentum indicator did not reach its previous high. The slowing momentum suggests that the recent uptrend may have slowly lost steam, and a consolidation period may be on the horizon.   The index has continued its up trend after 3 weeks of sideway consolidation and reached our first resistance target of 5340. With the slowing momentum, it is uncertain if the index can reach its second resistance level at 5500. 


The weekly chart of the S&P 500 index


Fund Rankings Update, 5/31/2024

Weekly Average Momentum Index (AMI) rankings of HSA, SSPP, RSP, SELECT, ETF, iETF, and sETF have been posted on "Rankings", and "Trading Logs" pages, as well as in http://ycprankings.awardspace.us/RankingTables.htm.


Trading signal occurs in the sETF model portfolio: Sell IEO, Buy IDU.


US stocks closed lower this week with technology shares leading the way down.  Economic data released during the week signals a benign economic environment. The core PCE index, Fed's favorite inflation gauge, went down 0.2% and the unemployment claims came in with 219000, in line with expectation.  Despite these positive economic data, all major indexes still finished in the red.  For the week, the S&P 500 fell 0.51% to 5277, the Dow Jones Industrial Average decreased 0.98%, and the Nasdaq composite index dropped 1.1%.

A divergence between the S&P 500 index and its momentum indicator has occurred in the weekly chart. The index has made a higher high in the weekly chart while its momentum indicator has made a lower high.  This suggests that the recent rally may have run out of steam, and we may see a consolidation period ahead.   The index has hovered around the 5300 level for the past 3 weeks after reaching the record high.  It remains to be seen whether the index will continue its upward trend or experience a pullback from here.


The weekly chart of the S&P 500 index


Fund Rankings Update, 5/24/2024

Weekly Average Momentum Index (AMI) rankings of HSA, SSPP, RSP, SELECT, ETF, iETF, and sETF have been posted on "Rankings", and "Trading Logs" pages, as well as in http://ycprankings.awardspace.us/RankingTables.htm.


Trading signal occurs in FEMKX timing system: Sell Cash, Buy FEMKX.


Stocks closed mixed for the week with the S&P 500 index and Nasdaq composite index making another all-time high while the Dow Jones Industrial Average suffered the worst setback since April.  The focus and the major driving factor of the tech stocks is the quarterly earning report from AI-giant NVIDIA on Wednesday after the market close.  NVIDIA stock went up more than 9% after reporting a 262% increase in quarterly revenue and a 629% increase in quarterly earnings over last year, handsomely beating Wall Street's expectations.  The boost from NVIDIA did not translate into broader markets as economic data showed the economic growth rebound in May which raised the speculation for the Fed to wait longer before cutting the interest rate.  For the week, the S&P 500 went up 0.03% to 5304, the Dow Jones Industrial Average decreased 2.33% and the Nasdaq composite index advanced 1.41%.

The S&P 500 index closed the week before the long weekend almost flat indicating that it is searching for a direction at this record high junction.  We think the index will continue to march higher as the index is 6.6% above its 28-week EMA, within the historical norm, and its momentum indicator is high in the overbought region.  The next levels ahead are the 5340, and 5500 from the Fibonacci analysis.


The weekly chart of the S&P 500 index


Fund Rankings Update, 5/17/2024

Weekly Average Momentum Index (AMI) rankings of HSA, SSPP, RSP, SELECT, ETF, iETF, and sETF have been posted on "Rankings", and "Trading Logs" pages, as well as in http://ycprankings.awardspace.us/RankingTables.htm.


Stocks advanced for the fourth week with the major indices, Dow Jones, S&P500, and Nasdaq, all reaching record highs.  The major factor boosting investors' sentiment was the April CPI index released on Wednesday. The CPI index came in lower than expected contrary to the higher-than-expectation PPI index released a day before. The core CPI in April rose 0.3% in line with the expectation while headline CPI rose the same 03% a tick below the expectation. The moderation of the inflation pressure lowered the treasury yields and propped up the major stock prices to all-time highs.   For the week, the S&P 500 went up 1.54% to 5303, the Dow Jones Industrial Average, breaking the 40000 psychological barrier,  increased 1,24% and the Nasdaq composite index jumped 2.11%.

As discussed, the S&P 500 index broke the previous high of 5262 without hesitation which signaled the continuation of the bull trend.  The index is now in uncharted territory, with each new high being an all-time record making it difficult to predict where the top will be.  Using Fibonacci analysis, the potential resistance levels were identified at 5340, 5500, and 5650. Only time will tell how high the index will climb.


The weekly chart of the S&P 500 index


Fund Rankings Update, 5/10/2024

Weekly Average Momentum Index (AMI) rankings of HSA, SSPP, RSP, SELECT, ETF, iETF, and sETF have been posted on "Rankings", and "Trading Logs" pages, as well as in http://ycprankings.awardspace.us/RankingTables.htm.


Trading signal occurs in HSA model portfolio: Sell VFTAX, Buy CSMUX


Stocks advanced for the third week with light trading volume as Wednesday's market saw the third lightest trading volume day of the year.  Economic calendars were not as busy either with only initial jobless claims and the University of  Michigan consumer sentiment index released on Thursday and Friday respectively.  Higher initial jobless claims and lower consumer sentiment all pointed to a slow economy and softer labor markets.   For the week, the S&P 500 went up 1.85% to 5222, the Dow Jones Industrial Average increased 2.16% and the Nasdaq composite index jumped 1.14%.

With the strong advance, the S&P 500 index is closing in on its all-time high of 5265.  Next week is critical in determining the index's direction:  A decisive move above the 5265 and holding there would signal the continuation of the up-trend while a rejection at 5265 could create a double-top bearish formation on the weekly chart.


The weekly chart of the S&P 500 index


Fund Rankings Update, 5/3/2024

Weekly Average Momentum Index (AMI) rankings of HSA, SSPP, RSP, SELECT, ETF, iETF, and sETF have been posted on "Rankings", and "Trading Logs" pages, as well as in http://ycprankings.awardspace.us/RankingTables.htm.


Stocks nudged upward for the second week under a slew of economy data and company earning reports.   The positive reception to Apple's earning report on Thursday and the less-than-expected  nonfarm payroll data on Friday morning boosted investor sentiments.  The slowdown in the labor market and the monthly wage increase lessened the investors' worries about the inflation pressure.  For the week, the S&P 500 went up 0.55% to 5127, the Dow Jones Industrial Average increased  1.14% and the Nasdaq composite index jumped 1.43%.

The S&P 500 index started the week on the weak side falling below its 50-day exponential moving average but crawled back above the EMA and ended up a bit higher than its opening price to close the week. The price action formed a hammer candle pattern on the weekly chart which is deemed to be bullish.  However, The momentum indicator STO[15,1] of the index sits at 67.43, nestled  between the overbought and oversold thresholds suggesting a sideway consolidation may be in store for the next few weeks. May is traditionally a weak month for stock markets as the adage, "Sell in May and go away" goes.  It remains to be seen if this adage holds true for the S&P 500 this year.  


The weekly chart of the S&P 500 index


Fund Rankings Update, 4/26/2024

Weekly Average Momentum Index (AMI) rankings of HSA, SSPP, RSP, SELECT, ETF, iETF, and sETF have been posted on "Rankings", and "Trading Logs" pages, as well as in http://ycprankings.awardspace.us/RankingTables.htm.


Trading signal occurs in sETF model portfolio, Sell ITB, Buy IEO


Stocks recovered some of the loss ground after three weeks of selloff as investors responded to the positive company earning reports and the buying opportunities created by the recent slump in tech shares.   Economy data released later in the week also boosted investors' sentiments. On Thursday, The Commerce Department reported that the US economy grew at an annual pace of 1.6% well below the estimated 2.5%, and on Friday it released the core personal consumption expenditures (core PCE) index of 2.82% month over month in March showing inflation continued its downward trajectory since October last year.   For the week, the S&P 500 jumped 2.67% to 5099, the Dow Jones Industrial Average nudged up  0.67% and the Nasdaq composite index rebounded 4.23%.

The S&P 500 index rebounded sharply this week, climbing back above the key psychological level of 5,000. However, momentum indicators are now falling below the overbought threshold of 80, suggesting a potential pullback or consolidation period.  We're closely watching the 4800 level, which remains critical support based on our previous analysis. The index's behavior around this level will be a key indicator of its near-term direction.


The weekly chart of the S&P 500 index


Fund Rankings Update, 4/19/2024

 Weekly Average Momentum Index (AMI) rankings of HSA, SSPP, RSP, SELECT, ETF, iETF, and sETF have been posted on "Rankings", and "Trading Logs" pages, as well as in http://ycprankings.awardspace.us/RankingTables.htm.


Trading signal occurs in FEMKX timing system, Sell FEMKX, Buy Cash


Stocks pulled back for the third week as tension in the Middle East and concerns of a higher and longer interest environment continued to weigh in on investors' sentiments.   On Monday, The Commerce Department reported that retail sales in March went up 0.7% much higher than the expected 0.3%, which increased investors' worries about the Fed putting off the interest rate cut further out of the year. And nn Tuesday, Fed Chair Jerome Powell indicated at an economic conference that it will take longer than expected to achieve that confidence to tame the inflation.  For the week, the S&P 500 fell 3.05% to 4967, the Dow Jones Industrial Average nudged up  0.01% and the Nasdaq composite index plunged 5.52%.

The S&P 500 index has declined for three weeks in a row, with a sharp pullback this week that brought it under the key psychological level of 5,000. The gap between the index and its 28-week exponential moving average has narrowed significantly, going from 9.6% three weeks ago to a modest 2.0%.  4800 will be a critical support level below for the index as it is near trendline support, the 50% Fibonacci retracement, and the previous high in January 2022.  The behavior of the index at this level will tell us if this is a buying opportunity or the start of a longer downturn.


The weekly chart of the S&P 500 index