Weekly Average Momentum Index (AMI) rankings of HSA, SSPP, RSP, SELECT, ETF, iETF, and sETF have been posted on "Rankings", and "Trading Logs" pages, as well as in http://ycprankings.awardspace.us/RankingTables.htm.
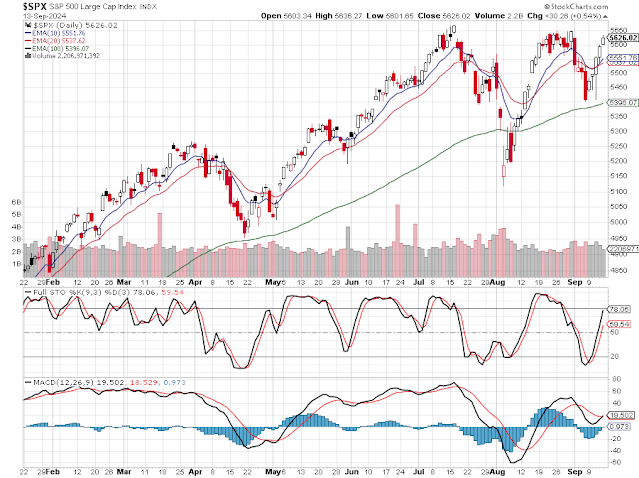
Stocks closed sharply higher recovering the loss from the previous week with help from technology sectors. Core inflation in August released on Wednesday went up 0.3%, a tick higher than expected, while the headline inflation peaked at 2.5%, well below the 2.9% in July. For the week, The S&P 500 went up 4.02%, closing at 5626, the Dow Jones Industrial Average advanced 2.6%, and the Nasdaq composite index jumped 5.95%.
The S&P 500 index has successfully tested the 100-day EMA support and closed above its 10-day and 20-day EMAs on the daily chart. While the index did not fully test its 28-week EMA support at 5300 on the weekly chart, the price action suggests that it has completed the "W" shape recovery pattern and will likely continue its upward trend. Any dips to the 10-day or 20-day EMAs can be seen as buying opportunities.
 |
| The weekly chart of the S&P 500 index |
 |
| The daily chart of the S&P 500 index |
No comments:
Post a Comment