Fund Rankings Update, 12/26/2014

Weekly Average Momentum Index (AMI) rankings of HSA, SSPP, RSP, SELECT, ETF, iETF, sETF have been posted at "Rankings", "Trading Logs" pages, and  http://ycprankings.awardspace.us/RankingTables.htm.


Trading signal occurs in iETF model portfolio: Sell INP, buy FXI.


Stocks trended higher during this short holiday trading week as investors were in a festive mood. Economy data also helped in boosting the markets: US economy was unexpectedly strong as the third quarter GDP  was revised upward to 5% while weekly job report showed lower jobless claims and consumer sentiment improved.  For the week, S&P 500 index closed at 2088, up 0.88%.  Dow Jones Industrial Average gained 1.4%, and Nasdaq composite index increased 0.87%.   

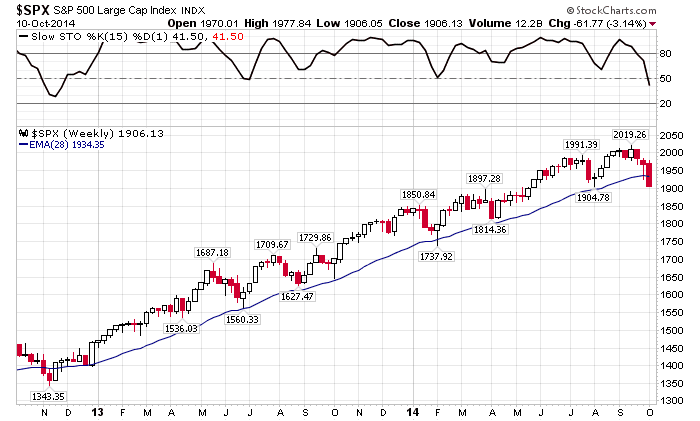
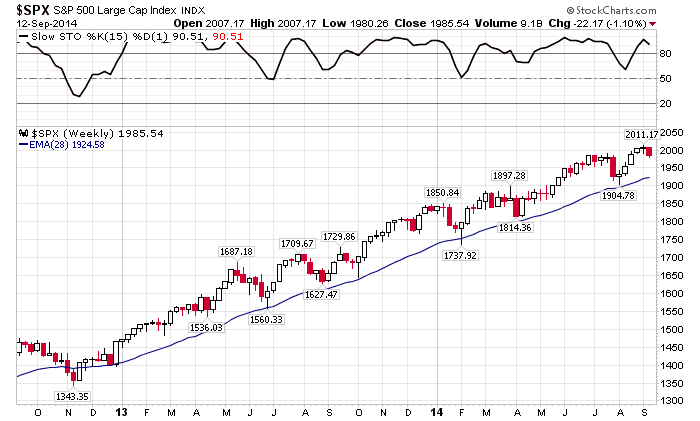
The upward momentum looks to carry the S&P 500 index higher into early next year as shown in the weekly chart below.  Looking forwards to 2015, we see low oil prices and strong US dollars to continue with interest rate creeping up. The stock volatility will increase and vigilant is warranted as this rally has been more than three year old. Wish everyone a happy and prosper new year!

Weekly chart of S&P 500 index

Fund Rankings Update, 12/19/2014

Weekly Average Momentum Index (AMI) rankings of HSA, SSPP, RSP, SELECT, ETF, iETF, sETF have been posted at "Rankings", "Trading Logs" pages, and  http://ycprankings.awardspace.us/RankingTables.htm.


Federal Reserve's "patient in raising interest" announcement on Wednesday boosted investors' sentiment and reverse the slide of stock prices in last week. S&P 500 index closed at 2070, up 3.41%. Dow Jones Industrial Average gained 3.03%, and Nasdaq composite index increased 2.4%.

S&P 500 index rebounded nicely from its 28 week moving average as seen in the weekly chart below. The chart pattern of the past 2 week is very similar to what happened in early April. As the index is still above its trend line with high upward momentum, we can expect the continuation of the uptrend.  

Some readers have asked me about when and at what price the oil price will bottom out. Looking at the weekly chart of $WTIC, one can find that the index is still trending down will very low momentum. Usually to spot a trend reversal in the chart, we need a few things: a "W" pattern in the price movement, a positive cross over in "MACD" indicator, and "STO" climbs above the extreme over sold level of 20. A bottom is formed before the trend reversal and that's why we only know the bottom after it was formed and can not tell it "during" its formation. With the current strong plunge in $WTIC, it is likely that the index will keep falling and eventually bounces back to hit the resistance by its 28 week moving average then falls back down to the second bottom before it forms a "W". It is the second bottom in the "W" pattern that a risk tolerant investor can take advantage of.  However, even if we can spot a bottom, we still do not know how strong the subsequent uptrend is. 

Weekly chart of S&P 500 index

Weekly chart of Light Crudel Oil Price

Fund Rankings Update, 12/12/2014

Weekly Average Momentum Index (AMI) rankings of HSA, SSPP, RSP, SELECT, ETF, iETF, sETF have been posted at "Rankings", "Trading Logs" pages, and  http://ycprankings.awardspace.us/RankingTables.htm.


Collapse of oil prices pull down the major indices.  S&P 500 index closed at 2002, down 3.52%. Dow Jones Industrial Average lost 3.783%, and Nasdaq composite index decreased 2.66%.

With the sell off, S&P 500 index has fallen close to its 28 week moving average of 1976. Looking back at early April and late July, we can observe the similar one week sell off in the weekly chart below. If the past experience is of any indication, whether S&P 500 index can rebound from its support next week is important to the continuation of this uptrend. 

As the sharp sell-off  in stock prices is caused by the collapse in oil prices, let's look at the daily chart of the $WTIC. The price of oil has come down since July, and the rate of falling has increased and reached the maximum as shown by the blue lines. At the end of this selling phase, we usually can see the price stabilized and rebound occurs. In the daily candle stick chart, this will happen when the "hammer" pattern shows up and the "MACD" gives a positive cross over.  

Weekly chart of S&P 500 Index
Daily chart of light oil price

Fund Rankings Update, 12/06/2014

Weekly Average Momentum Index (AMI) rankings of HSA, SSPP, RSP, SELECT, ETF, iETF, sETF have been posted at "Rankings", "Trading Logs" pages, and  http://ycprankings.awardspace.us/RankingTables.htm.


Strong job reports and rebound in oil prices pushed the major indices to record high while technology sectors remained flat.  S&P 500 index closed at 2075, up 0.38%. Dow Jones Industrial Average gained 0.73%, and Nasdaq composite index decreased 0.23%.

S&P 500 index appears to be in a consolidation mode. In the weekly chart, its price pattern has flatten out for the past two week. However, the technical picture of the index stays the same, and we expect the up-trend with small consolidation will continue for the next few weeks. 

This is the time a lot of mutual funds and ETFs distribute their dividends and capital gains. I have to manually update the price one fund at a time, and the information may not be readily available. The momentum rankings may display some instability this month. 


Weekly chart of S&P 500 Index

Fund Rankings Update, 11/28/2014

Weekly Average Momentum Index (AMI) rankings of HSA, SSPP, RSP, SELECT, ETF, iETF, sETF have been posted at "Rankings", "Trading Logs" pages, and  http://ycprankings.awardspace.us/RankingTables.htm.


Collapse of Oil prices on Friday did to stop the rise of  major indices in this holiday shorten week.   S&P 500 index closed at 2067, up 0.2%. Dow Jones Industrial Average gained 0.1%, and Nasdaq composite index increased 1.67%.

After the "V" shape bounce in mid October, the S&P 500 index has been in the rising trend with high momentum. The up trend is expected to last, however, the index is currently trading at the top of its rising channel and a slowdown to digest the gain may occur in the next few weeks. 

Weekly chart of S&P 500 index

Fund Rankings Update, 11/21/2014

Weekly Average Momentum Index (AMI) rankings of HSA, SSPP, RSP, SELECT, ETF, iETF, sETF have been posted at "Rankings", "Trading Logs" pages, and  http://ycprankings.awardspace.us/RankingTables.htm.


Trading signal occurs in FEMKX model portfolio: Sell Cash, buy FEMKX.

China surprised the financial markets by cutting interest rate, the first in two year,  to avoid hard landing in its economy. Investors appeared to welcome the stimulus measure and pushed the major indices higher. S&P 500 index closed at 2063, up 1.16%. Dow Jones Industrial Average gained 0.99%, and Nasdaq composite index increased 0.52%.

Fund Rankings Update, 11/14/2014

Weekly Average Momentum Index (AMI) rankings of HSA, SSPP, RSP, SELECT, ETF, iETF, sETF have been posted at "Rankings", "Trading Logs" pages, and  http://ycprankings.awardspace.us/RankingTables.htm.

Falling oil prices helped boosted retail sales, and the volatility in stock prices has reduced greatly the past week. Stocks edged up higher to reach another record high. S&P 500 index closed at 2039, up 0.39%. Dow Jones Industrial Average advanced 0.35%, and Nasdaq composite index fared better with a gain of 1.21%.

Fund Rankings Update, 11/7/2014

My laptop stopped working while I am still on my trip. Weekly Average Momentum Index (AMI) rankings of HSA, SSPP, RSP, SELECT, ETF, iETF, sETF will be either posted late or skipped for the week.


Continued strong company earning and healthy US job growth boosted stocks to a new high. S&P 500 index closed at 2031, up 0.69%. Dow Jones Industrial Average gained 1.05%, and Nasdaq composite index increased 0.04% for the week.

Fund Rankings Update, 10/31/2014

Weekly Average Momentum Index (AMI) rankings of HSA, SSPP, RSP, SELECT, ETF, iETF, sETF have been posted at "Rankings", "Trading Logs" pages, and  http://ycprankings.awardspace.us/RankingTables.htm.


Strong US company earning reports and U.S. economy growth continued to move stocks higher. S&P 500 index closed at 2018, up 2.72%. Dow Jones Industrial Average gained 3.48%, and Nasdaq composite index increased 3.28%.   

In the weekly chart of S&P 500 index, the price has climbed to reach the previous high of 2019 and the STO momentum has escalated above 50. The technical indicators all point to a continuation of the uptrend. 


Weekly chart of S&P 500 index

Fund Rankings Update, 10/24/2014

Weekly Average Momentum Index (AMI) rankings of HSA, SSPP, RSP, SELECT, ETF, iETF, sETF have been posted at "Rankings", "Trading Logs" pages, and  http://ycprankings.awardspace.us/RankingTables.htm.


Strong US company earning reports trumped worries about global economy slow down. Stocks rebounded strongly from extreme over bought condition., and recorded the best weekly gain in two years.  For the week, S&P 500 index closed at 1964, up 4.12%. Dow Jones Industrial Average gained 2.59%, and Nasdaq composite index increased 5.29%.   

Just as we said that it is unlikely we will get a "V" shape rebound this time, all major indices rebounded strongly and S&P 500 index went up 78 points to get back above its 28 week moving average again. A "V" shape rebound is forming in the weekly chart of S&P 500 index as shown in the picture below. From technical point of view, we would like the index to hold above the 28 week MA and has its momentum index, STO, climbing back above 50 to assure us that the rally will continue after interruption by the sell-off.

Weekly chart of S&P 500 index

Fund Rankings Update, 10/17/2014

Weekly Average Momentum Index (AMI) rankings of HSA, SSPP, RSP, SELECT, ETF, iETF, sETF have been posted at "Rankings", "Trading Logs" pages, and  http://ycprankings.awardspace.us/RankingTables.htm.


Trading signal occurs in sETF model portfolio: Sell IYW, buy IBB.


Stocks experienced extreme volatility this past week, we saw Dow Jones Industrial average had 900 point swing for the week. Finally major indices rebounded from extreme oversold condition Friday to lessen the damage. For the week, S&P 500 index closed at 1886, down 1.02%. Dow Jones Industrial Average lost 0.99%, and Nasdaq composite index decreased 0.42%.   

A long tail "hammer" candle was formed in the weekly chart of S&P 500 index. Its tail reached near the 1810 level that we have discussed last week. After reaching that level, investors managed to pull the index up and closed the week with only 1% loss, which confirms the 1810 short term support level.  Since the index is fully below the 28 week moving average, the trend line turns from support to resistance, which stands at 1930. With the severe sell-off in the past few weeks, we do not expect the index will bounce right up with the "V" shape pattern like those in the past two years. Most likely we will see the index retest the short term support and stay below the trend line for few weeks to work off the volatility.  

A trading signal was issued in the sETF model portfolio to sell technology fund, IYW, and buy into Biotech fund, IBB. Biotech funds have been holding up quite well in the face of this sell-off relative to the general market. We have held IYW for 74 days with a loss of 3.12%.


Weekly chart of S&P 500 index

Fund Rankings Update, 10/10/2014

Weekly Average Momentum Index (AMI) rankings of HSA, SSPP, RSP, SELECT, ETF, iETF, sETF have been posted at "Rankings", "Trading Logs" pages, and  http://ycprankings.awardspace.us/RankingTables.htm.


Trading signal occurs in HSA model portfolio: Sell OPMYX, buy MLAAX.
Trading signal occurs in SELECT model portfolio: Sell FSELX, buy FBIOX.


Sell-off exacerbated due to continuation of worries about global slowdown especially on economy data from Europe indicating that Germany maybe in recession this year.  For the week, S&P 500 index closed at 1906, down 3.14%. Dow Jones Industrial Average lost 2.74%, and Nasdaq composite index decreased 4.45%.   

Stocks experienced high volatility this past week. As seen in the weekly chart of S&P 500 index below, we did not get the positive confirmation of the reversal signal we have discussed last week in the blog. Instead, a long red candle has penetrated the 28 week moving average and the index has closed below its trend line, the first time in almost two years. The STO momentum indicator also fell sharply below 50. This may indicate that stock market is digesting the total gain of this non-stop rally the first time since December 2012.  From that perspective, there are a couple support levels worth watching:  a short term support at 1810 and further down at 1710. If the index fails to close above it trend line next week, the market correction will be confirmed and investors should move to sideline to reduce risk exposure.

Two trading signals were issued this week due to high market volatility. Small cap fund, OPMYX, is replaced with large cap fund, MLAAX, in HSA model portfolio, and electronic sector fund, FSELX, is replaced with biotech sector fund, FBIOX, in SELECT model portfolio. Detail of the trading record can be seen in the "Trading Logs" page.


Weekly chart of S&P 500 index

Fund Rankings Update, 10/3/2014

Weekly Average Momentum Index (AMI) rankings of HSA, SSPP, RSP, SELECT, ETF, iETF, sETF have been posted at "Rankings", "Trading Logs" pages, and  http://ycprankings.awardspace.us/RankingTables.htm.


Trading signal occurs in ETF model portfolio: Sell FXI, buy IBB.


Continuation of weak investor sentiment and worries about global slowdown especially in Europe and China pushed the markets down for the week. The loss was somewhat reduced on Friday due to economy data showing strong job creation in September, and a drop in unemployment rate below 6%.  For the week, S&P 500 index closed at 1967, down 0.75%. Dow Jones Industrial Average lost 0.6%, and Nasdaq composite index decreased 0.81%.   

In the weekly chart below, we can see S&P 500 index touched the trend line and made a "hammer" candle stick pattern. Similar patters in the past have resulted in continuation of the up trend and provided a short term buying opportunity.  A positive bias next week will give us confirmation of the past pattern, and may take us up to the end of the year.

Another trading signal was issued in ETF model portfolio this week. China index fund, FXI, is replaced with Biotech sector Fund, IBB, due to AMI rank change. FXI was held for 53 days with a loss of 6.7%. 

Weekly chart of S&P 500 index


Fund Rankings Update, 9/26/2014

Weekly Average Momentum Index (AMI) rankings of HSA, SSPP, RSP, SELECT, ETF, iETF, sETF have been posted at "Rankings", "Trading Logs" pages, and  http://ycprankings.awardspace.us/RankingTables.htm.


Trading signal occurs in RSP model portfolio: Sell 42625, buy FCNTX.


Nervous sentiment drove up the volatility of stock markets this past week. Investors tried to reduce their risk exposure on every small bad news that came out, whether it is geopolitical tension or even Apple's OS trouble. DIJA dropped more than 250 points in one day Thursday.  For the week, S&P 500 index fell below 2000 level again and closed at 1982, down 1.375%. Dow Jones Industrial Average lost 0.92%, and Nasdaq composite index decreased 1.48%.   

In the weekly chart below, we can see S&P 500 index is still consolidating at the 2000 level and waiting for the trend line to catch up. Looking back earlier this year in February and March time frame, the index spent 8-9 weeks consolidating around 1900 levels before its final breakout so there should be no surprise this time. We just have to let this consolidation run its course but keep a vigilant eye as sentiment can change suddenly.

A trading signals was issued in RSP model portfolio this week. SSgA emerging market index (42625) is replaced with Fidelity CONTRA Fund, FCNTX, due to AMI rank change and its failure to sustain the up trend. 42625 was held for 46 days with a loss of 3.33%.  


Weekly Chart of S&P 500 Index

Fund Rankings Update, 9/19/2014

Weekly Average Momentum Index (AMI) rankings of HSA, SSPP, RSP, SELECT, ETF, iETF, sETF have been posted at "Rankings", "Trading Logs" pages, and  http://ycprankings.awardspace.us/RankingTables.htm.


Trading signal occurs in SSPP model portfolio: Sell FICDX, buy FOCPX.
Trading signal occurs in FEMKX model portfolio: Sell FEMKX, buy CASH.

Investors felt relief as FED keep the easy money policy in place on Wednesday. They were also calmed by the "no" vote in Scottish independence referendum to break out from United Kindom on Friday.  S&P 500 index rose above 2000 level and closed at 2010, up 1.25%. Dow Jones Industrial Average gained 1.72%, and Nasdaq composite index increased 0.27% for the week.   

In the weekly chart, S&P 500 index is still flirting around the 2000 level. It will be interesting to see if the index can continue to advance next week and truly break out from the 2000 level. On the other hand, it may test the short term support at 1950 which we have mentioned last week if the break out fails. 

Two trading signals were issued this week. In SSPP model portfolio, FICDX is replaced with FOCPX due to AMI rank change. FICDX was bought in July when energy related sectors were outperforming others. However, the trend doese not sustain long engough and we have held FICDX for 74 days with a loss of 0.47%.  For FEMKX timing system, the STO indicator has dropped to 54 below the selling threshold and a trading signal is issued to move to cash position.  The model portfolio has held the fund since March for 200 days with a gain of 10.54%. 

Weekly chart of S&P 500 index

Fund Rankings Update, 9/12/2014

Weekly Average Momentum Index (AMI) rankings of HSA, SSPP, RSP, SELECT, ETF, iETF, sETF have been posted at "Rankings", "Trading Logs" pages, and  http://ycprankings.awardspace.us/RankingTables.htm.


With no major economic data weighing in on the markets, stocks finally took a break after gaining for five weeks.  S&P 500 index fell below 2000 level and closed at 1985, down 1.1%. Dow Jones Industrial Average lost 0.87%, and Nasdaq composite index decreased 0.33% for the week.   

In the weekly chart, S&P 500 index is still struggling around the 2000 level waiting for breakout. On the down side, a short term support around 1950- 1960 level can provide some buying opportunity if the rally holds.

Weekly chart of S&P 500 index

Fund Rankings Update, 9/5/2014

Weekly Average Momentum Index (AMI) rankings of HSA, SSPP, RSP, SELECT, ETF, iETF, sETF have been posted at "Rankings", "Trading Logs" pages, and  http://ycprankings.awardspace.us/RankingTables.htm.


Trading signal occurs in HSA model portfolio: Sell TVAFX buy OPMYX

Mixed economic news with strong manufacturing and service sector data and weak employment data ease investors' fear of FED's rate hike. News about cease fire agreement in Ukraine also help the market to elk out a small gain.  S&P 500 index stands at 2007, up 0.22%. Dow Jones Industrial Average gained 0.23%, and Nasdaq composite index increased 0.06% for the week.   

Technical picture of S&P 500 index remains the same as last week. The index is trying to consolidate above 2000 for the second week waiting for the trend line to catch up while daily and weekly momentum stay high.

Growth funds have outpaced valued funds in the past couple of months. A trading signal occurs in HSA model portfolio was issued to sell TVAFX which has fell to 7 in the momentum ranking table. We will replace the fund with the current number one ranked fund, OPMYX (see detail in Ranking and Trading Log pages). The model portfolio has held TVAFX for 263 days with a gain of 13.4%.

Weekly chart of S&P 500 index

Fund Rankings Update, 8/29/2014

Weekly Average Momentum Index (AMI) rankings of HSA, SSPP, RSP, SELECT, ETF, iETF, sETF have been posted at "Rankings", "Trading Logs" pages, and  http://ycprankings.awardspace.us/RankingTables.htm.


Positive economic data in 2nd quarter GDP out weighed the geopolitical tension in Ukraine this past week.  S&P 500 index stands at 2003, up 0.75%. Dow Jones Industrial Average gained 0.57%, and Nasdaq composite index increased 0.92% for the week.   

As shown in the weekly chart, S&P 500 index has resumed its up trend and reached the all time record high of 2000. It broke through 2000 on Monday and spent the next four days successfully defended the position.  As 2000 is an all time record high and a round number, we expect it to be a heavier psychological resistance and may cause more consolidation action. However, both daily and weekly momenta of the index are still heading higher, the intermediate up trend should stay intact.


Weekly chart of S&P 500 index

Fund Rankings Update, 8/22/2014

Weekly Average Momentum Index (AMI) rankings of HSA, SSPP, RSP, SELECT, ETF, iETF, sETF have been posted at "Rankings", "Trading Logs" pages, and  http://ycprankings.awardspace.us/RankingTables.htm.


Encouraged by strong economic data on housing starts and manufacturing activity, stocks advanced broadly this past week.  S&P 500 index stands at 1988, up 1.71%. Dow Jones Industrial Average gained 2.03%, and Nasdaq composite index increased 1.65% for the week.   

S&P 500 index continued its rebound from the 28 week moving average as shown in the weekly chart. The weekly momentum indicator, STO, has stopped falling and headed back up. The up trend since January 2013 has resumed and is expected to last for a while.

Weekly Chart of S&P 500 Index

Fund Rankings Update, 8/15/2014

Weekly Average Momentum Index (AMI) rankings of HSA, SSPP, RSP, SELECT, ETF, iETF, sETF have been posted at "Rankings", "Trading Logs" pages, and  http://ycprankings.awardspace.us/RankingTables.htm.


Stocks continued its rebound amid summer's light trading.  S&P 500 index stands at 1955, up 1.22%. Dow Jones Industrial Average gained 0.66%, and technology loaded Nasdaq composite index increase 2.15% for the week.   

S&P 500 index, following the past pattern, rebounded from trend line after forming a long tail candle in the weekly chart (see last week's blog). In the daily chart, the index has climbed back to its 50 day moving average, the STO indicator is crossing above 50, and the MACD has turned positive. As stated last week, investors who can tolerate higher risk level can start buying into the market to catch the next wave up. 

Weekly chart of SP 500 index

Daily chart of S&P 500 index

Fund Rankings Update, 8/8/2014

Weekly Average Momentum Index (AMI) rankings of HSA, SSPP, RSP, SELECT, ETF, iETF, sETF have been posted at "Rankings", "Trading Logs" pages, and  http://ycprankings.awardspace.us/RankingTables.htm.

Trading signal occurs in ETF model portfolio: Sell IGE, Buy FXI.
Trading signal occurs in RSP model portfolio: Sell 05087 (LSV LGE CP VALUE EQ), Buy 42625 (SSGA EMRG MKTS INDEX).

After sell-off a week before, markets tried to stabilize and manged to elk out a small gain amid lingering geopolitical tension and worries about European economic growth.  S&P 500 index climbed a bit to 1931, up 0.33%. Dow Jones Industrial Average gained 0.37%, and technology loaded Nasdaq composite index increase 0.42% for the week.   

Last week we talked about long tailed candled bounced off from trend line in weekly chart of S&P 500 index. As shown in the chart below, the long tail candle with the tip nearly touching the trend line. If the past pattern holds up, we should see the index turning around in the next week or two.  In the daily chart, the stochastic oscillator (STO) and MACD are turning around, and traders can start taking positions in the markets when daily STO climbs back above 20 and MACD histogram (blue number in the chart) becomes positive. 

The consolidation and sell-off have caused the sector rotation as traders and investors adjusted their portfolio to reduce the risk exposure. After last week's trading signal in sETF, we have two trading signals issued this week. In the ETF model portfolio, we change the position from engergy related IGE to China ETF fund, FXI, due to its economy recovery. In the RSP model portfolio, we are changing position from large cap fund, 05087 to emerging market index, 42627. We have held IGE for only 32 days with 4.12% loss and have held 05087 for 123 days with a gain of 2.88%.


Weekly Chart of S&P 500 Index

Daily Chart of S&P 500 Index

Fund Rankings Update, 8/1/2014

Weekly Average Momentum Index (AMI) rankings of HSA, SSPP, RSP, SELECT, ETF, iETF, sETF have been posted at "Rankings", "Trading Logs" pages, and  http://ycprankings.awardspace.us/RankingTables.htm.

Trading signal occurs in sETF model portfolio: Sell IEO, Buy IYW.

Selective default of Argentina's debt, bank trouble in Portuguese, and geopolitical tension in Ukraine and Gaza handed wall street the largest weekly drop the year.  S&P 500 index fell to 1925, down 2.59%. Dow Jones Industrial Average lost 2.75%, and technology loaded Nasdaq composite index decrease 2.18% for the week.   

As stock prices trending higher, they get more vulnerable to outside stimulus. In the weekly chart of S&P 500 index below, we can see the long red candles occurred 3 times this year. The first one in mid January, the second time in end of March and the third time this past week. In each time, the 28 week moving average was successfully tested and the index rebounded in a week of two. Currently, the 28 week moving average is at 1894 which is also the resistance level during March- May consolidation period. This 1890-1900 level should provide firm support to this pull-back and we hope that the market can rebound from there.

After hitting the $100 resistance in mid-June, IEO has been weak and has seen its momentum dropping. Its AMI rank dropped to 10 this past week, and we will replace it with the current number one ranked fund, IYW in the sETF ranking table. We have held IEO for 88 days with a profit of 1.4%.

Weekly Chart of S&P 500 Index

Fund Rankings Update, 7/25/2014

Weekly Average Momentum Index (AMI) rankings of HSA, SSPP, RSP, SELECT, ETF, iETF, sETF have been posted at "Rankings", "Trading Logs" pages, and  http://ycprankings.awardspace.us/RankingTables.htm.

Volatility due to company earning reports and geopolitical tension in Ukraine and Gaza continued this week. S&P 500 index is essentially flat at 1978, up 0.01%. Dow Jones Industrial Average lost 0.82%, and technology loaded Nasdaq composite index increase 0.39% for the week.   

Company earnings have been better than analysts' estimates. More than two thirds of the companies that have reported second quarter earnings have beaten Wall street's estimates. However, companies, like Amazon, McDonald's, which reported disappointing earnings were severely punished by investors. Weekly chart shows that S&P 500 index continued to be in a wait and see mode looking for direction. We think this holding pattern may continue for another few weeks as what had happened earlier this year in March to May time frame.


Weekly Chart of S&P 500 Index

Frund Rankings Update, 7/18/2014

Weekly Average Momentum Index (AMI) rankings of HSA, SSPP, RSP, SELECT, ETF, iETF, sETF have been posted at "Rankings", "Trading Logs" pages, and  http://ycprankings.awardspace.us/RankingTables.htm.

Stocks experienced higher volatility due to earning season and geopolitical tension in Ukraine and Gaza. Large cap stocks managed to advance while small cap stocks went down.  S&P 500 index closed at 1978, up 0.54%, Dow Jones Industrial Average gained 0.92%, and Nasdaq composite increase 0.38% for the week.   

Weekly chart shows that S&P 500 index has been flat for 3 weeks as investors digest the gain and seeking direction. However, that does not tell the whole picture of this consolidation. The large cap and mid cap companies has been holding up quite well during this consolidation, while small cap companies suffered. In the weekly chart of Russel 2000 index which represents small cap companies, the index has come down 5% from its previous high in the last two weeks.  

As for industrial sectors, other than energy sectors, technology sector is coming up strong which also boosted countries like Taiwan, Mexico and other emerging countries in the global arena.

Weekly Chart of S&P 500 Index

Weekly Chart of Russell 2000 Index

Fund Rankings Update, 7/11/2014

Weekly Average Momentum Index (AMI) rankings of HSA, SSPP, RSP, SELECT, ETF, iETF, sETF have been posted at "Rankings", "Trading Logs" pages, and  http://ycprankings.awardspace.us/RankingTables.htm.

Trading signal occurs in iETF model portfolio: Sell EWP, Buy INP

Just as we thought the financial crisis is behind us, a major bank in Portuguese failed to pay interest for some of its debt. Investors' worries about the health of European financial system pulled down the market for the week and gave the current rally an opportunity to digest its gain.  S&P 500 index closed at 1967, down 0.9%, Dow Jones Industrial Average lost 0.73%, and Nasdaq composite decrease 1.57% for the week.   

Profit taking to reduce exposure of risk before the 2000 physiological level can be seen in the weekly chart of S&P 500 index. The index is also trading at the top of its trending channel with high momentum. We may see another few weeks of consolidation, but at this stage, the pull back is considered a healthy pause to bring the index back to the middle of the trading channel.  


Weekly Chart of S&P 500 Index

Fund Rankings Update, 7/4/2014

Weekly Average Momentum Index (AMI) rankings of HSA, SSPP, RSP, SELECT, ETF, iETF, sETF have been posted at "Rankings", "Trading Logs" pages, and  http://ycprankings.awardspace.us/RankingTables.htm.


Trading signal occurs in SSPP model portfolio: Sell FRESX, Buy FICDX 
Trading signal occurs in ETF model portfolio: Sell EZA, Buy IGE 

Boosted by solid economy data and better than expected job report, stocks went up for the short trading week. S&P 500 index closed at 1985, up 1.25%, Dow Jones Industrial Average gained 1.28%, and Nasdaq composite increase 2.0% for the week.   

Energy related sectors have been very strong recently due to higher energy prices. Two trading signals were issued this week in SSPP and ETF model portfolios. In both cases,  the current holdings were replaced with energy related funds: FICDX and IGE. We have hold FRESX for 87 days with 5.2% gain and have hold EZA for 52 days with 0.35% profit. 

Stocks continue to trend up with high momentum. No one knows when the party will be over, but we will ride the trend up as long as we can with, of course, caution in mind.  Have a happy Independence Day holiday! 


Weekly Chart of S&P 500 Index


Fund Rankings Update, 6/27/2014

Weekly Average Momentum Index (AMI) rankings of HSA, SSPP, RSP, SELECT, ETF, iETF, sETF have been posted at "Rankings", "Trading Logs" pages, and  http://ycprankings.awardspace.us/RankingTables.htm.


Large cap indices retreated a bit at record high levels while technology sectors continued to advance. S&P 500 index closed at 1960, down 0.1%, Dow Jones Industrial Average lost 0.56%, while Nasdaq composite increase 0.68% for the week.   

Technical pictures for the major indices remain the same. We still expect some selling pressure as S&P 500 index and Dow Jones Industrial Average are at their record levels and the Nasdaq is at its previous high. The selling pressure looks to be in short term nature with no threat to the current up-trend.

Weekly chart of S&P 500 index


Fund Rankings Update, 6/20/2014

Weekly Average Momentum Index (AMI) rankings of HSA, SSPP, RSP, SELECT, ETF, iETF, sETF have been posted at "Rankings", "Trading Logs" pages, and  http://ycprankings.awardspace.us/RankingTables.htm.


Stocks resume its steady march this past week. S&P 500 index closed at 1962, up 1.38%, Dow Jones Industrial Average gained 1.02%, and Nasdaq composite increase 1.33% for the week.   

Although the short term pulled back to support level did not happened this past week and all Major indices advanced to new highs, S&P 500 is a couple of percentage away from its resistance of 2000 and Nasdaq is right at its resistance of 4370.  Consolidation or temporary pause is expected in the next couple of weeks. 

This week is the 10th anniversary of this blog site. The ranking posts started on June 18, 2004 with two AMI ranking tables: SSPP and SELECT, and were originally posted on Yahoo's site. Over the years, the rankings tables were expanded to include HSA, RSP, ETF, sETF and iETF. During this 10 years, we have experienced booming market between 2005 - 2008, great recession in 2008 - 2009, market recovery between 2009 - 2012, and the bull market since 2012. It even surprises me that I have not missed one week of posting. At the end, the performance of SSPP and SELECT hold up pretty well compared with the general market performance. Thanks you all for reading the posts in the past and hope you keep supporting this blog site. 


Weekly chart of S&P 500 index

S&P 500 Index: 10 Year Monthly Chart