Trading signal occurs in SELECT model portfolio: Sell FSELX, buy FBIOX.
Sell-off exacerbated due to continuation of worries about global slowdown especially on economy data from Europe indicating that Germany maybe in recession this year. For the week, S&P 500 index closed at 1906, down 3.14%. Dow Jones Industrial Average lost 2.74%, and Nasdaq composite index decreased 4.45%.
Stocks experienced high volatility this past week. As seen in the weekly chart of S&P 500 index below, we did not get the positive confirmation of the reversal signal we have discussed last week in the blog. Instead, a long red candle has penetrated the 28 week moving average and the index has closed below its trend line, the first time in almost two years. The STO momentum indicator also fell sharply below 50. This may indicate that stock market is digesting the total gain of this non-stop rally the first time since December 2012. From that perspective, there are a couple support levels worth watching: a short term support at 1810 and further down at 1710. If the index fails to close above it trend line next week, the market correction will be confirmed and investors should move to sideline to reduce risk exposure.
Two trading signals were issued this week due to high market volatility. Small cap fund, OPMYX, is replaced with large cap fund, MLAAX, in HSA model portfolio, and electronic sector fund, FSELX, is replaced with biotech sector fund, FBIOX, in SELECT model portfolio. Detail of the trading record can be seen in the "Trading Logs" page.
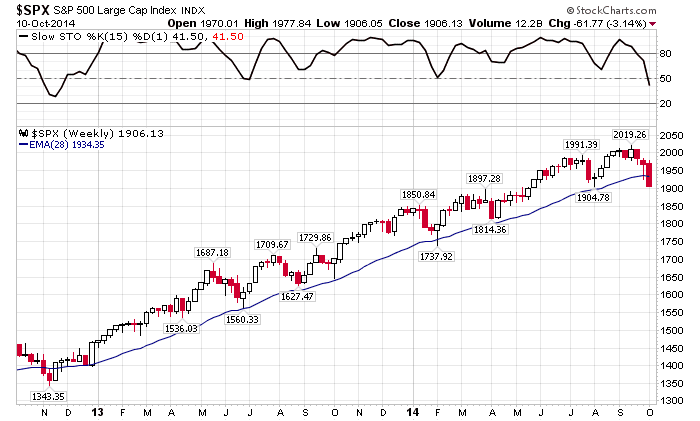 |
| Weekly chart of S&P 500 index |
No comments:
Post a Comment