Fund Rankings Update, 10/24/2014

Weekly Average Momentum Index (AMI) rankings of HSA, SSPP, RSP, SELECT, ETF, iETF, sETF have been posted at "Rankings", "Trading Logs" pages, and  http://ycprankings.awardspace.us/RankingTables.htm.


Strong US company earning reports trumped worries about global economy slow down. Stocks rebounded strongly from extreme over bought condition., and recorded the best weekly gain in two years.  For the week, S&P 500 index closed at 1964, up 4.12%. Dow Jones Industrial Average gained 2.59%, and Nasdaq composite index increased 5.29%.   

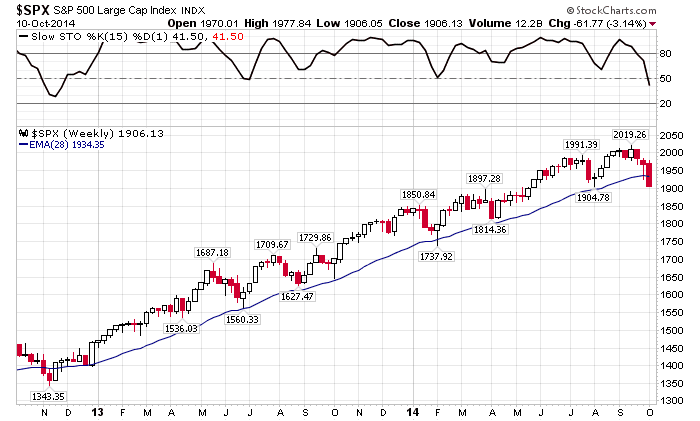
Just as we said that it is unlikely we will get a "V" shape rebound this time, all major indices rebounded strongly and S&P 500 index went up 78 points to get back above its 28 week moving average again. A "V" shape rebound is forming in the weekly chart of S&P 500 index as shown in the picture below. From technical point of view, we would like the index to hold above the 28 week MA and has its momentum index, STO, climbing back above 50 to assure us that the rally will continue after interruption by the sell-off.

Weekly chart of S&P 500 index

Fund Rankings Update, 10/17/2014

Weekly Average Momentum Index (AMI) rankings of HSA, SSPP, RSP, SELECT, ETF, iETF, sETF have been posted at "Rankings", "Trading Logs" pages, and  http://ycprankings.awardspace.us/RankingTables.htm.


Trading signal occurs in sETF model portfolio: Sell IYW, buy IBB.


Stocks experienced extreme volatility this past week, we saw Dow Jones Industrial average had 900 point swing for the week. Finally major indices rebounded from extreme oversold condition Friday to lessen the damage. For the week, S&P 500 index closed at 1886, down 1.02%. Dow Jones Industrial Average lost 0.99%, and Nasdaq composite index decreased 0.42%.   

A long tail "hammer" candle was formed in the weekly chart of S&P 500 index. Its tail reached near the 1810 level that we have discussed last week. After reaching that level, investors managed to pull the index up and closed the week with only 1% loss, which confirms the 1810 short term support level.  Since the index is fully below the 28 week moving average, the trend line turns from support to resistance, which stands at 1930. With the severe sell-off in the past few weeks, we do not expect the index will bounce right up with the "V" shape pattern like those in the past two years. Most likely we will see the index retest the short term support and stay below the trend line for few weeks to work off the volatility.  

A trading signal was issued in the sETF model portfolio to sell technology fund, IYW, and buy into Biotech fund, IBB. Biotech funds have been holding up quite well in the face of this sell-off relative to the general market. We have held IYW for 74 days with a loss of 3.12%.


Weekly chart of S&P 500 index

Fund Rankings Update, 10/10/2014

Weekly Average Momentum Index (AMI) rankings of HSA, SSPP, RSP, SELECT, ETF, iETF, sETF have been posted at "Rankings", "Trading Logs" pages, and  http://ycprankings.awardspace.us/RankingTables.htm.


Trading signal occurs in HSA model portfolio: Sell OPMYX, buy MLAAX.
Trading signal occurs in SELECT model portfolio: Sell FSELX, buy FBIOX.


Sell-off exacerbated due to continuation of worries about global slowdown especially on economy data from Europe indicating that Germany maybe in recession this year.  For the week, S&P 500 index closed at 1906, down 3.14%. Dow Jones Industrial Average lost 2.74%, and Nasdaq composite index decreased 4.45%.   

Stocks experienced high volatility this past week. As seen in the weekly chart of S&P 500 index below, we did not get the positive confirmation of the reversal signal we have discussed last week in the blog. Instead, a long red candle has penetrated the 28 week moving average and the index has closed below its trend line, the first time in almost two years. The STO momentum indicator also fell sharply below 50. This may indicate that stock market is digesting the total gain of this non-stop rally the first time since December 2012.  From that perspective, there are a couple support levels worth watching:  a short term support at 1810 and further down at 1710. If the index fails to close above it trend line next week, the market correction will be confirmed and investors should move to sideline to reduce risk exposure.

Two trading signals were issued this week due to high market volatility. Small cap fund, OPMYX, is replaced with large cap fund, MLAAX, in HSA model portfolio, and electronic sector fund, FSELX, is replaced with biotech sector fund, FBIOX, in SELECT model portfolio. Detail of the trading record can be seen in the "Trading Logs" page.


Weekly chart of S&P 500 index

Fund Rankings Update, 10/3/2014

Weekly Average Momentum Index (AMI) rankings of HSA, SSPP, RSP, SELECT, ETF, iETF, sETF have been posted at "Rankings", "Trading Logs" pages, and  http://ycprankings.awardspace.us/RankingTables.htm.


Trading signal occurs in ETF model portfolio: Sell FXI, buy IBB.


Continuation of weak investor sentiment and worries about global slowdown especially in Europe and China pushed the markets down for the week. The loss was somewhat reduced on Friday due to economy data showing strong job creation in September, and a drop in unemployment rate below 6%.  For the week, S&P 500 index closed at 1967, down 0.75%. Dow Jones Industrial Average lost 0.6%, and Nasdaq composite index decreased 0.81%.   

In the weekly chart below, we can see S&P 500 index touched the trend line and made a "hammer" candle stick pattern. Similar patters in the past have resulted in continuation of the up trend and provided a short term buying opportunity.  A positive bias next week will give us confirmation of the past pattern, and may take us up to the end of the year.

Another trading signal was issued in ETF model portfolio this week. China index fund, FXI, is replaced with Biotech sector Fund, IBB, due to AMI rank change. FXI was held for 53 days with a loss of 6.7%. 

Weekly chart of S&P 500 index